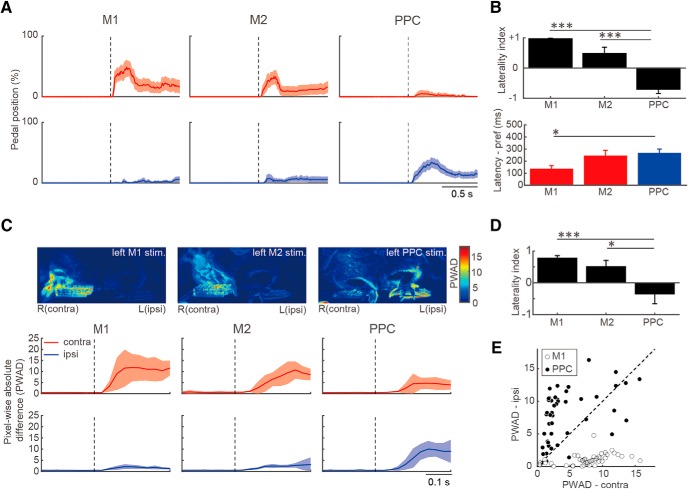
Figure 7.
Forelimb movements evoked by optogenetic activation of motor cortices and PPC. A, Temporal changes in contralateral (red) and ipsilateral (blue) pedal position (mean ± SEM) evoked by optogenetic activation (dashed line) of M1, M2, and PPC in ChR2-expressing Thy1-ChR2 rats (M1: n = 11, M2: n = 11, PPC: n = 16). B, Laterality index (top) and latency (bottom) of the pedal position change (mean ± SEM) evoked by optogenetic activation. The latency was measured on the preferred side determined by the laterality index (contralateral for M1 and M2; ipsilateral for PPC). C, Video analysis of forelimb movements by the same optogenetic activation. Top, Representative images of PWAD evoked by optogenetic activation of the left M1, M2, and PPC. Bottom, Temporal changes in PWAD for contralateral (red) and ipsilateral (blue) forelimbs. D, Laterality index of forelimb deviation in PWAD evoked by optogenetic activation. E, Forelimb movements evoked by optogenetic M1 and PPC activation in a pedal-free (dangling) condition in several rats (n = 5). Open and filled circles represent M1 and PPC stimulation, respectively, each of which was plotted by the PWAD values for contralateral (abscissa) and ipsilateral (ordinate) forelimbs. *p < 0.05, ***p < 0.001; Kruskal–Wallis test with post hoc Scheffe's test.

