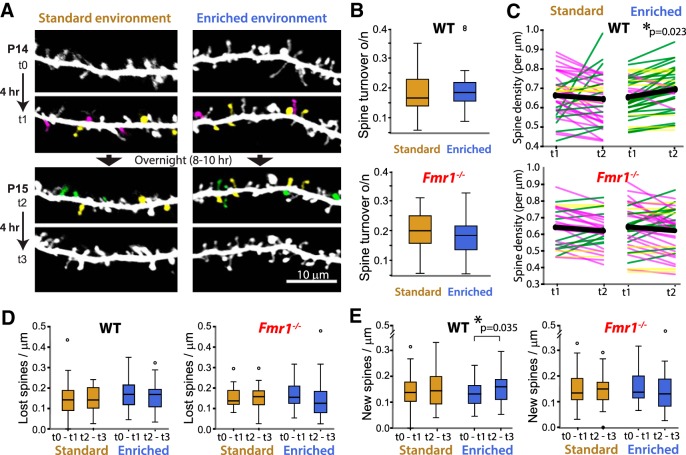
Figure 5.
Dendritic spines of L2/3 neurons in Fmr1 KO mice are insensitive to EE at P14. A, Best projection in vivo two-photon images of dendritic spines of representative L2/3 neurons from WT mice. Images for EE experiments were acquired as follows: at P14, 4 h apart (t0 and t1); animals were then housed overnight (for 8–10 h) either in SE or in EE and imaged again twice at P15, 4 h apart (t2 and t3). Subsets of representative spines are pseudo-colored: yellow represents persistent spines; magenta represents lost spines; and green represents newly formed spines (with respect to overnight period). B, ToR of spines in L2/3 neurons of WT (top) and Fmr1 KO (bottom) mice housed overnight in SE or EE. C, Density of spines in L2/3 neurons of WT (top) and Fmr1 KO (bottom) mice housed overnight in SE or EE. There is significant increase in spine density after EE in WT mice. Each line indicates the average of all ROIs for an individual neuron. Green, magenta, and gray lines indicate an increase, a reduction, or no change in spine density, respectively, for individual cells. Thick black lines indicate the average for all the cells. D, Rates of spine elimination for L2/3 neurons in WT mice (left) and Fmr1 KO mice (right). E, Rates of formation of new dendritic spines of L2/3 neurons in WT mice (left) and Fmr1 KO mice (right). The rate of spine formation was significantly higher in WT mice immediately after EE, but not in Fmr1 KO mice or WT mice housed in SE.

