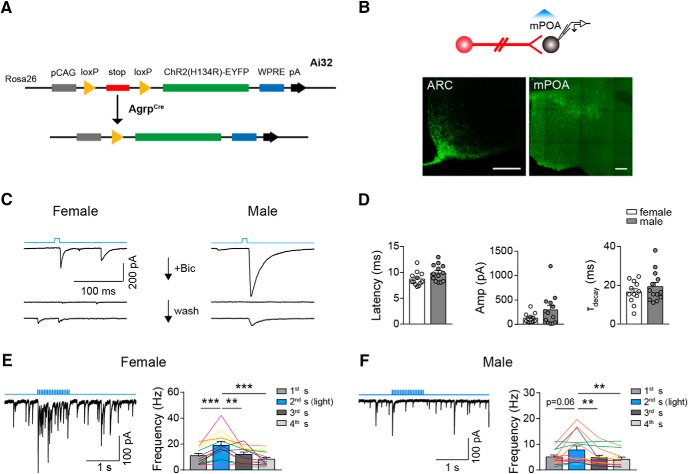
Figure 2.
AGRP neurons form inhibitory synapses onto mPOA neurons. A, Illustration of the genetic strategy to optogenetically activate AGRP neurons and terminals. Cre induces excision of the stop codon to allow expression of ChR2 fused with EYFP in AGRP neurons and terminals. B, Schematics showing brain slice recording to identify mPOA neurons downstream of AGRP neurons. Representative images at the bottom show EYFP signal in the ARC and the mPOA. Scale bar, 200 μm. C, Representative traces of light-induced IPSCs in mPOA neurons in female (left) and male (right) by a single light pulse as indicated by the top blue line, which can be blocked by addition of Bicuculline (Bic) and recover after wash. N = 3 cells from 1 female and 2 cells from 1 male. D, Quantification of the latency, amplitude (Amp), and decay time constant (τ) of IPSCs recorded in mPOA neurons in female and male AGRPChR2 animals, respectively. N = 12 cells from 6 AGRPChR2 females and 13 cells from 5 AGRPChR2 males as represented by open and filled circles respectively. E, F, Left, Representative trace of light-induced IPSCs in mPOA neurons by a train of light as indicated by the top blue line. Right, Quantification of IPSC frequency in 1 s segments before, during, and after light stimulation. N = 13 cells from 6 AGRPChR2 females and 15 cells from 5 AGRPChR2 males. The same color lines denote cells recorded from the same animals. All bar values are presented as mean ± SEM. **p < 0.01; ***p < 0.001.

