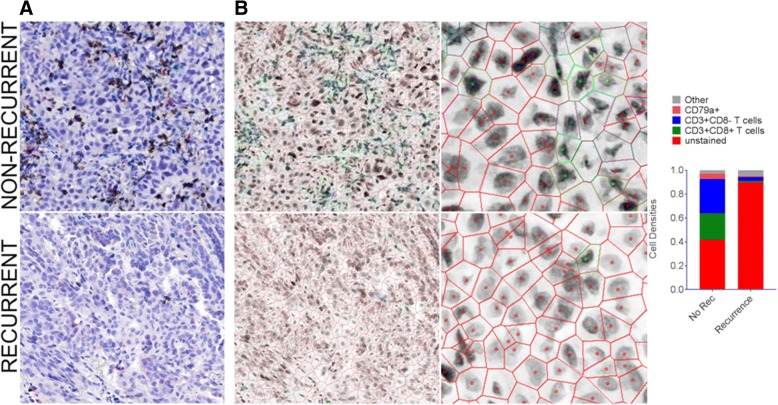
Fig. 3.
Comparison of cell densities between a recurrent and a non-recurrent lung tumor. Multiplexed immunohistochemistry staining of a non-recurrent case (top row) and a recurrent case (bottom row) of lung adenocarcinoma is shown. a White light imaging of the IHC stained tissue (CD3 (blue), CD8 (dark brown), CD79a (red), haematoxylin (nuclear counter stain)). b Voronoi diagrams of these cases are shown at equal magnification (left panels) and at increased magnification (right panels). Voronoi diagrams and cell centres are false colored red (unstained), blue (CD3+ T cells), green (CD3+ CD8+ T cells), and pink (CD79a+ B cells). (C) Cell densities of each cell types are indicated in the bar graph to the right, with “excluded” cells colored grey. These correspond to cells excluded from analysis, defined in Additional file 3: Figure S3

