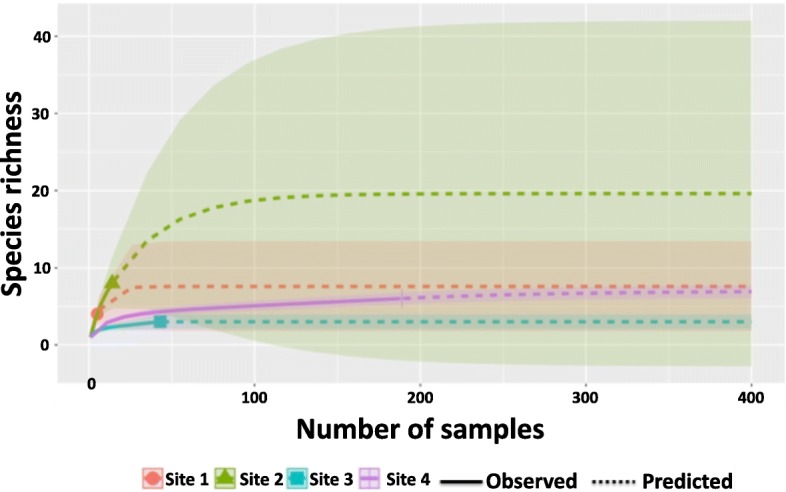
Fig. 4.

Rarefaction curves showing the influence of sample size on Culicoides species richness for each sampling site: Site 1 in red, Site 2 in green, Site 3 in blue and Site 4 in purple. Solid lines indicate the observed sample size and species richness whereas dashed lines represent the predicted sample size and species richness
