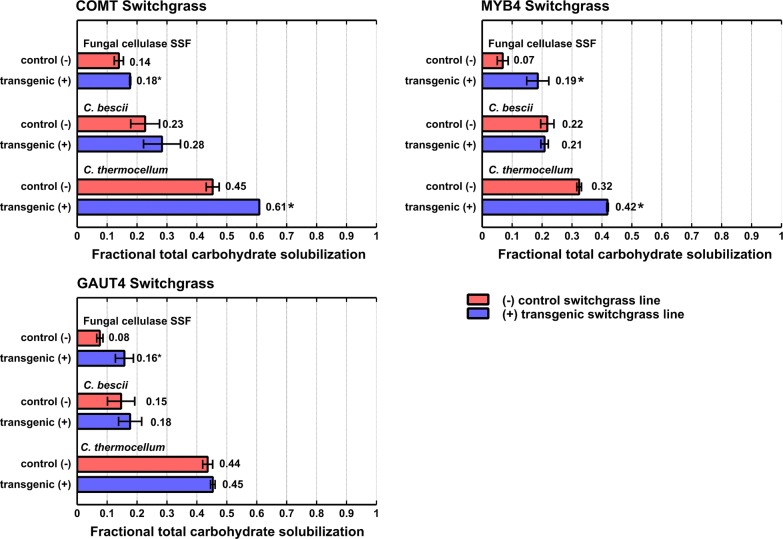
Fig. 1.
Fractional total carbohydrate solubilization for three transgenic switchgrass lines and their controls mediated by three different biocatalysts. Fungal cellulase was loaded at 5 mg/g solids and in a 9:1 ratio for Ctec2 and Htec2. Red bars show solubilization for the control plant lines (−) and blue bars show solubilization for the transgenic switchgrass lines (+). Initial solids concentrations were based on equal glucan loadings, and fermentations were done in duplicate. Solubilization results are after 120 h of incubation. Error bars represent one standard deviation and are based on biological replicates. Both COMT and MYB4 represent modifications in the lignin pathway, and GAUT4 represents modification in the pectin pathway. An asterisk (*) indicates that the difference in solubilization between transgenic and control plant lines was statistically significant at p ≤ 0.05. Details of the statistical analysis are presented in Additional file 2: Table S3

