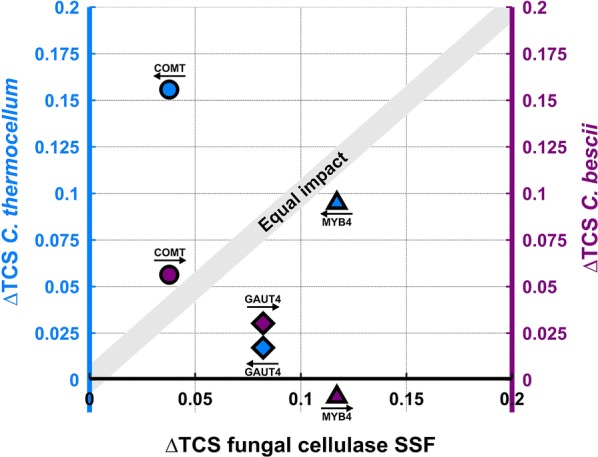
Fig. 2.

Increased fractional total carbohydrate solubilization (ΔTCS = TCS for transgenic plant lines − TTCS for unmodified controls) for three different plant line pairs and three different biocatalysts. Diamond shaped markers denote GAUT4, circles COMT, and triangles MYB4. ΔTCS for fungal cellulase SSF is on the x-axis. ΔTCS is plotted on the left axis for C. thermocellum, and on the right axis for C. bescii, as indicated by the arrows. The ‘equal impact’ line represents equal increase in solubilization for the different biocatalyst–plant modification combinations. Overall solubilization results are after 120 h of incubation and from duplicate fermentation runs. Both COMT and MYB4 represent modifications in the lignin pathway, and GAUT4 represents modification of the pectin pathway
