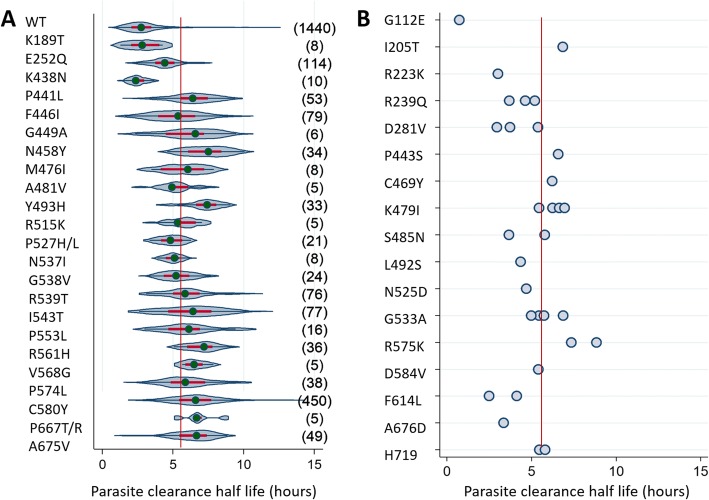
Fig. 4.
Distribution of parasite clearance half-life by pfk13 mutant codons in isolates from Asia. Left panel (a) shows violin plots for mutant codons with five or more isolates. The number of individual isolates tested is at the right of each violin plot. The right panel (b) shows dot plots for mutant codons with < 5 isolates. The red line shows a half-life of 5.5 h. The median is shown as a green circle, the red bar corresponds to the interquartile range, and the curve represents kernel estimate of the density function. * 22 P527H and 1 P527L with PC1/2 = 5.8h; ** 6 P667T and 1 P667R without valid PC1/2 measurement, so not considered

