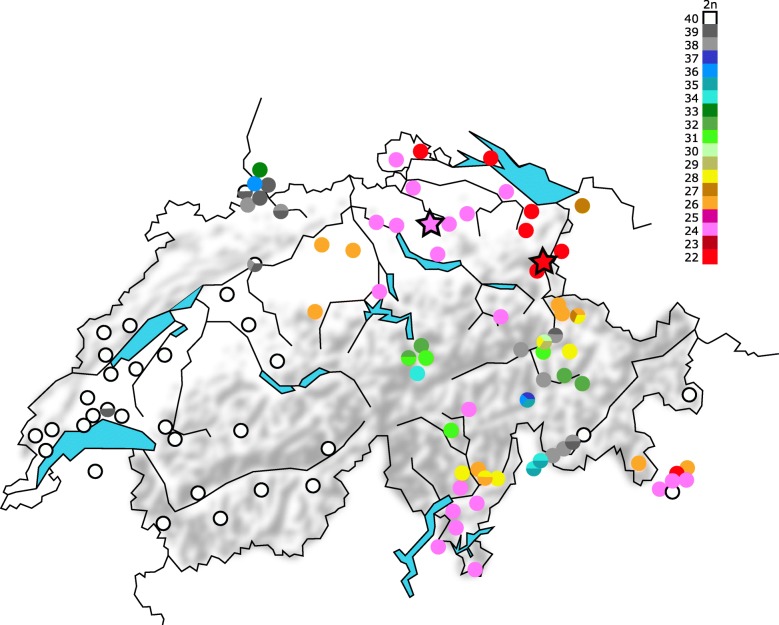
Fig. 1.
Map of chromosomal variation in house mice in Switzerland and neighbouring areas. The trapping sites of the two races used in this study are marked with stars (pink for CHHN, red for CHBU: see text). The red star represents three closely located trapping sites (within 4 km). Information on the Swiss races was taken from Piálek et al. [9], Hübner [27] and Gropp et al. [64]

