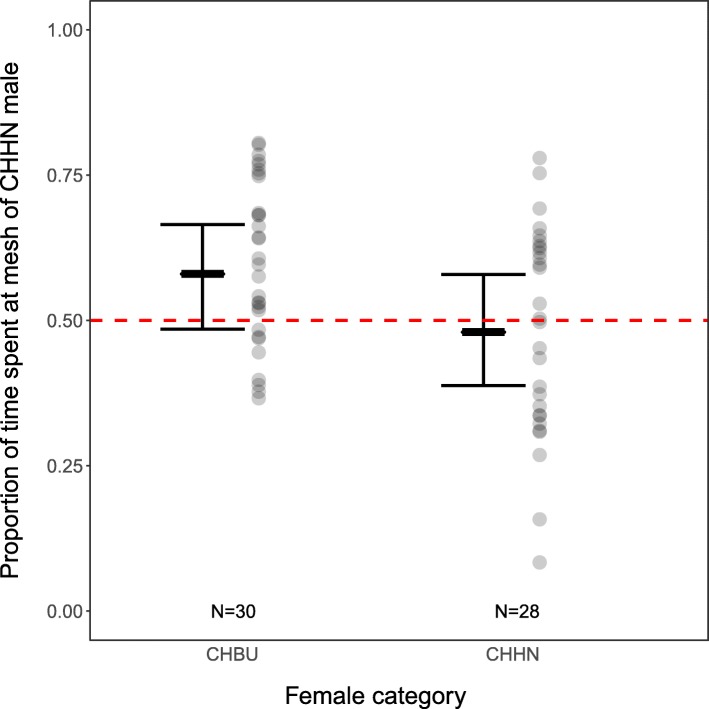
Fig. 9.
Relative time that females spent near the CHHN male when presented with males of both races. A value of 0.5 (dashed line) represents equal amount of time spent near either male. Positive values indicate more time spent near the CHHN male, negative values more time spent near the CHBU male. The grey circles represent the actual data points, while the bars represent the linear mixed model’s estimate of the means (thick horizontal bars) and the 95%-confidence intervals for females of either race

