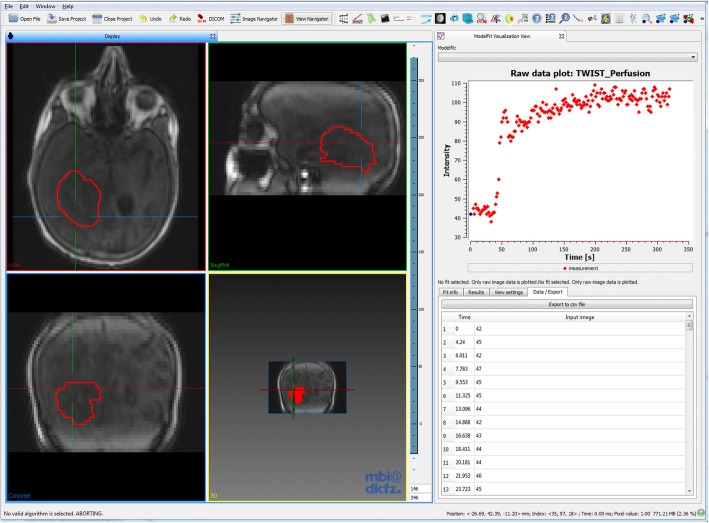
Fig. 4.
Screenshot of the MITK workbench and the MFI plug-in (right), with exemplary DCE MRI data from a glioblastoma patient. In the 4-window view, the acquired 3D images can be viewed at each time point. The MFI plug-in enables display of the signal-time curves in each image voxel (crosshair). The respective signal-time curve can be exported as 2-column .csv file

