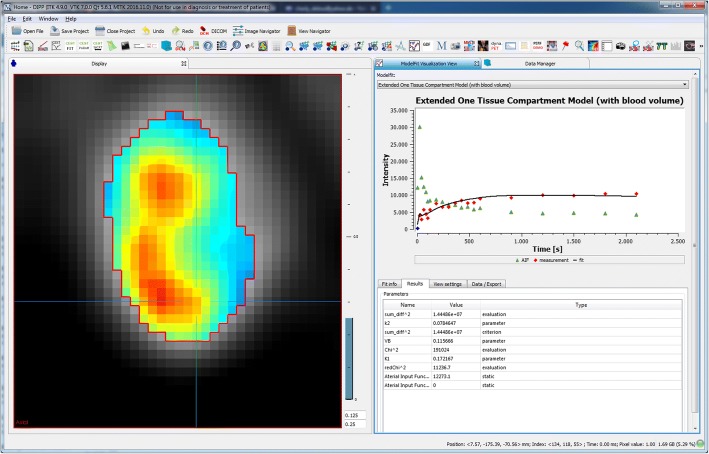
Fig. 8.
Example case of application of the fitting software for tracer-kinetic analysis in dynamic PET, using the tracer kinetic one tissue compartment model. The image shows the parameter map of the exchange rate K1. In the MFI, the measured time-activity curve in tissue (red) with corresponding fit (black) and the utilized arterial time-activity curve (green) are displayed

