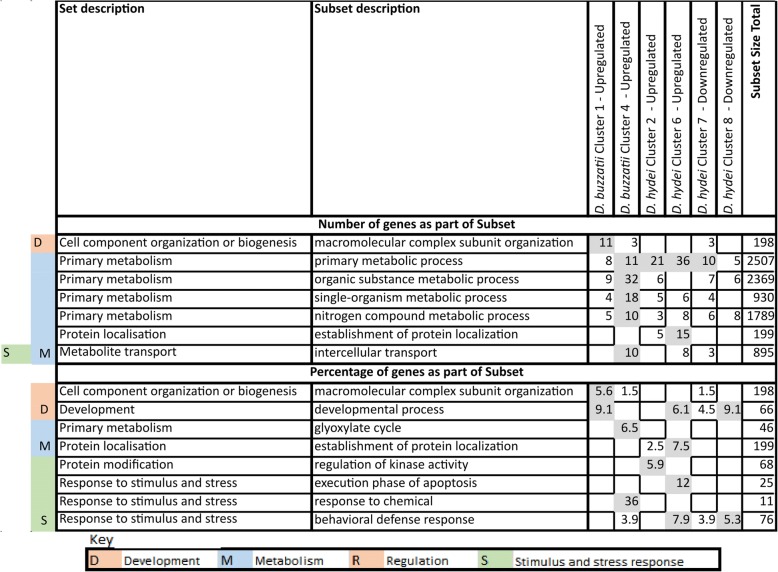
Fig. 6.
GO subsets most represented among the genes in the species in excess that lack orthologues in the same cluster in the other species in the fuzzy-c means clusters in the differential expression analyses. Representation is expressed in terms of either the total number (top) or percentage (below) of genes from the subset in question in the species in excess (again excluding any that also had orthologues in the other species in the same cluster). Only subsets containing more than 10 genes were analysed and only those where more than ten genes (top) or more than 5% (below) were involved in any one of the six clusters analysed are shown. These values are shaded. However for those subsets included on these criteria, any non-zero involvement in any of the other analyses are also shown, but not shaded. See the Methods section for further details of the methods used to generate this figure

