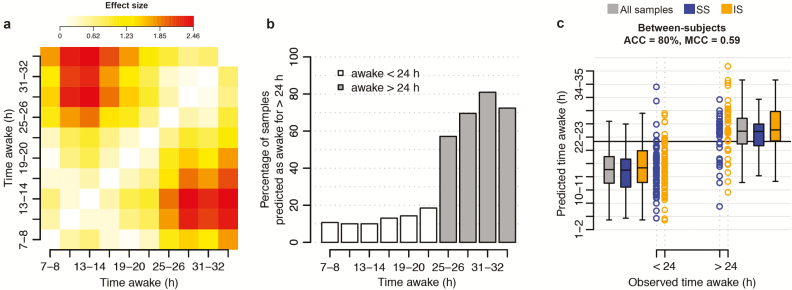
Figure 4.
Predicted “time awake” value for classifying “wakefulness of >24 hr.” (a) Difference between the mean predicted value of “time awake” for samples collected at x hours awake and samples collected at y hours awake. Difference expressed as Cohen’s d effect size. Data based on predictions made for samples within the “UPUS” training data set when using the “all features” elastic net model for “time awake” trained on all samples within the “UPUS” training data set. No baseline correction applied. (b) Percentage of samples predicted to have a “time awake” value of greater than 24 hr for all observed values of “time awake.” Data based on predictions made for samples within the “UPUS” validation data set when using the “all features” elastic net model for “time awake” trained on all samples within the “UPUS” training data set. (c) Classification performance when classifying a sample within the “UPUS” validation set to one of two classes, “awake > 24 hr,” “awake < 24 hr” using the predicted “time awake” value of a sample using the “all features” elastic net model for “time awake” trained on all samples within the “UPUS” training data set. Black horizontal line represents the decision boundary at 24 hr. ACC = accuracy, SS= samples from sufficient sleep condition, IS = samples from insufficient sleep condition.

