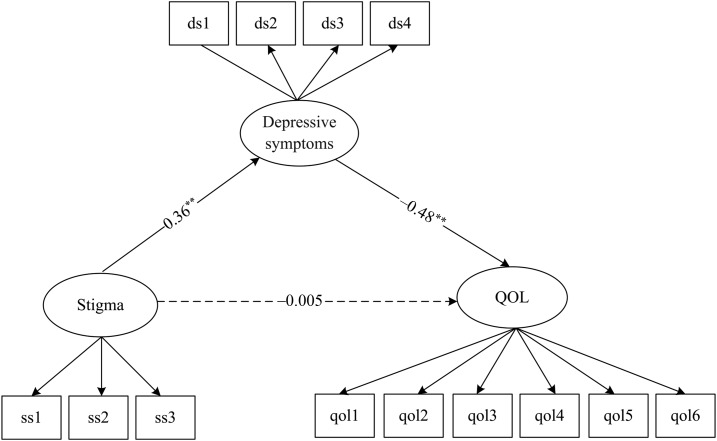
Figure 2.
Mediation model for quality of life (QOL) (model 2) Note: All the coefficients in the figure were standardized. Model was adjusted for age and gender, **P < 0.01; goodness-of-fit index (GFI) = 0.94; adjusted GFI = 0.91; Tucker–Lewis index = 0.91; comparative fit index = 0.93; root mean square error of approximation = 0.07. The arrow with the dotted line represents the effect between stigma and QOL that is not statistically significant (standardized estimates: β = −0.005, P = 0.88). Questionnaire items of QOL labeled qol1, qol2, qol3, qol4, qol5, and qol6. Three dimensions of the Tuberculosis-Related Stigma scale labeled ss1, ss2, and ss3. Four subscales of the Center for Epidemiologic Studies Depression scale labeled ds1, ds2, ds3, and ds4.

