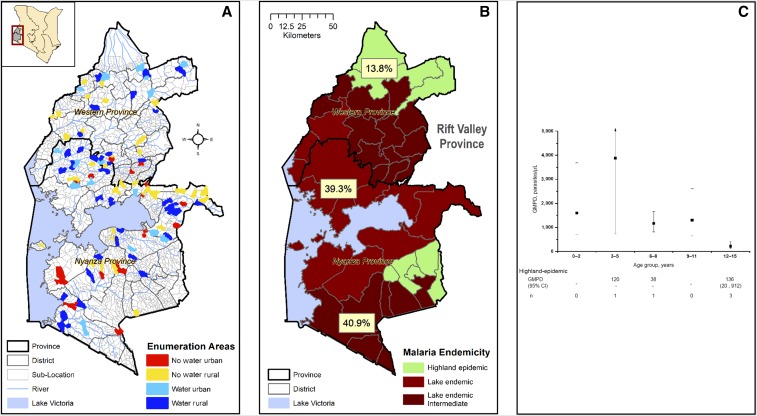
Figure 2.
(A) Map showing the study area in Kenya. The location of the study area is marked by a rectangular box, and the details of study area are shown in the zoom out including regions named Western Province and Nyanza Province, based on the old administrative names present before the Constitutional change of 2013. Details include the provincial, district, and sublocation, which is also the census enumeration area (EA), boundaries. The selected EAs are color coded to indicate their distribution and stratification: rural or urban status and proximity to surface water (see Methods and Materials). (B) This figure shows Plasmodium falciparum prevalence (pfPR) in the study region divided into malaria-epidemiological zones (see Introduction). The lake-endemic area is divided into a lakeshore area (lighter shade of red, labeled lake-endemic) and a more inland area (darker shade of red, lake-endemic intermediate), and the highland-epidemic (lime green). (C) Age-specific patterns of geometric mean parasite density (GMPD), parasites/μL. Data for the lake-endemic area are plotted. The solid square represents the GMPD and short horizontal bars connected by a vertical line represent 95% confidence bands of the GMPD. Because of sparse data, GMPD results for the highland-epidemic area are not graphed but tabulated below the graph. The numbers shown in the graph are for children who were positive on TFM with quantified parasites. The total number of children tested by thick film microscopy (TFM) is similar to those shown in Figure 3B, except for the 6- to 8-year age group in which 18 children were tested by TFM. This figure appears in color at www.ajtmh.org.

