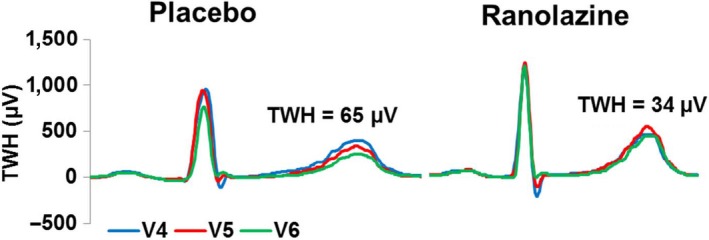
Figure 1.

Digitized tracings from a representative patient illustrating the reduction in T‐wave heterogeneity (TWH) by ranolazine at rest compared with placebo. The complexes obtained from ECG leads V4, V5, and V6 are QRS aligned. Note that with placebo, TWH is markedly elevated at 65 μV while it is reduced to 34 μV following ranolazine administration
