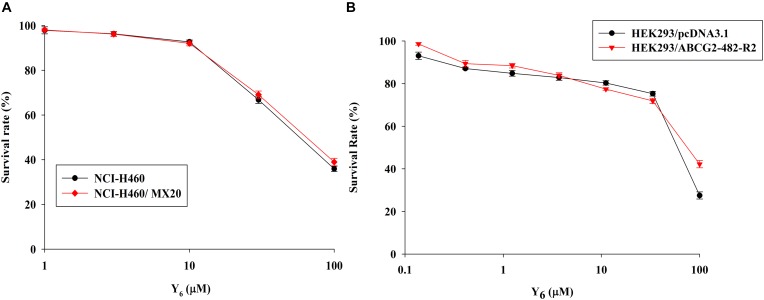
FIGURE 2.
The cytotoxicity of Y6 in parental and ABCG2-overexpressing cells. (A) Cytotoxicity of Y6 was evaluated in parental NCI-H460 and ABCG2-overexpressing NCI-H460/MX20 cells. (B) Cytotoxicity of Y6 was evaluated in transfected HEK293/pcDNA3.1 and ABCG2-overexpressing HEK293/ABCG2-482-R2 cells. Cells were incubated with different concentration of Y6 for 72 h. Survival rate was determined by MTT assay. Representative curves were shown as cell survival rate verses concentration of compounds. Points and error bars display the mean and SD.

