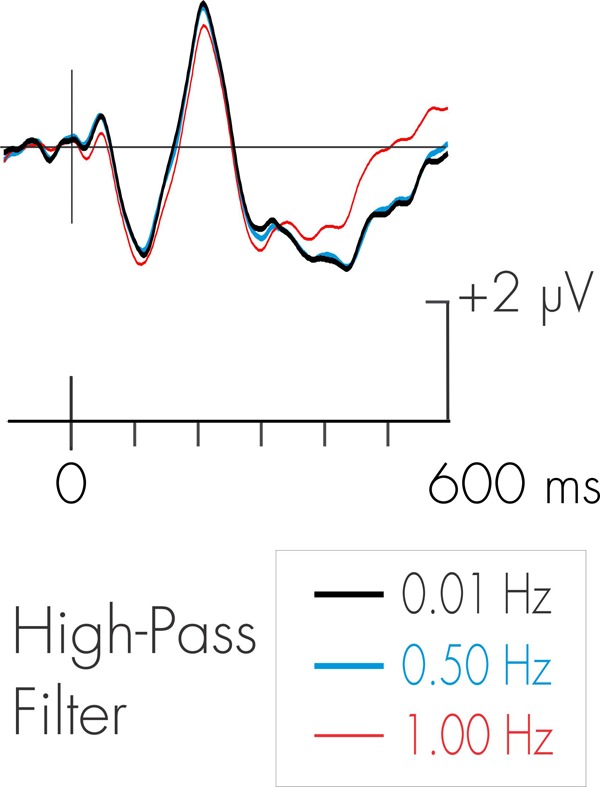
FIGURE 2.

Effects of different high-pass filters on the P3a. ERP waveforms represent pilot data deviant-standard difference wave (environmental sound deviant) for 10 subjects in the waking state. As can be observed, there were minimal effects on the amplitude of the P3a with the use of various high-pass filters.
