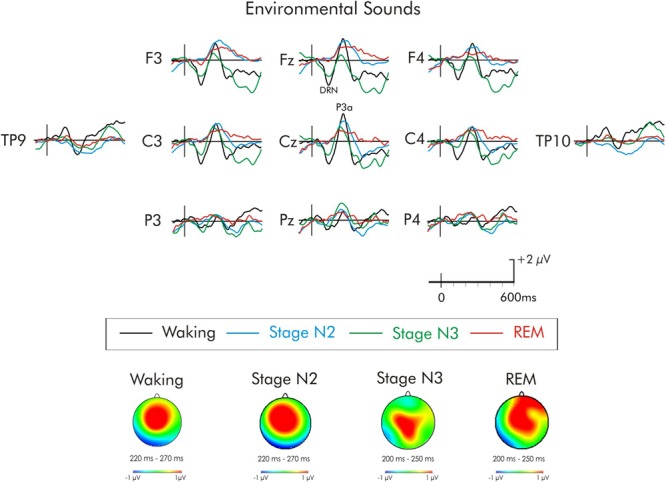
FIGURE 5.

Grand average difference waveform for the environmental sounds at multiple scalp sites. The waveforms for the four different stages are superimposed. A significant P3a was observed in the waking state. A significant P3a-like positivity was also observed during stages N2 and REM. A subsequent positivity at about 320 ms can also be observed unique to REM sleep. Spline maps (bottom portion of Figure) are also presented for waking and stages N2, N3, and REM at the time interval of the P3a. During waking, stage N2, and stage REM, the P3a-like positivity was largest over centro-frontal regions, decreasing in amplitude over posterior and lateral regions. During stage N3, the distribution was more centro-parietal.
