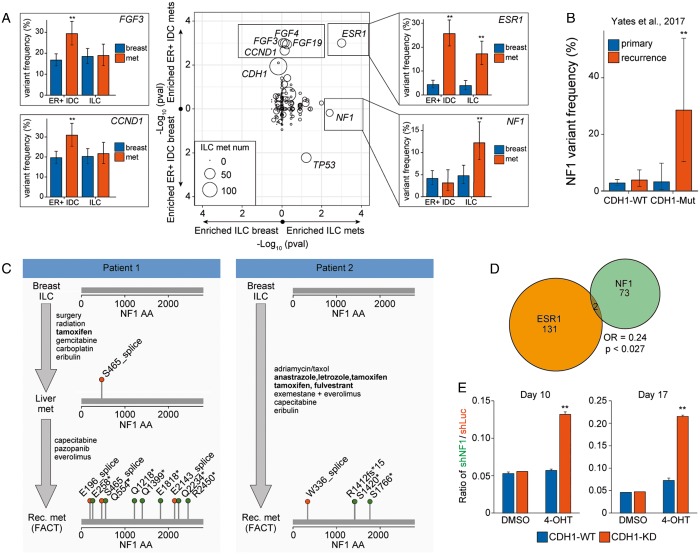
Figure 3.
NF1 alterations are frequently identified in metastatic invasive lobular carcinomas (ILCs) and may drive endocrine therapy resistance. (A) Gene variant frequencies were compared between local breast ILC and metastatic breast ILC (x-axis) and between local ER-positive breast invasive ductal carcinoma (IDC) and metastatic ER-positive breast IDC (y-axis). Plotted is the Fisher’s exact P-value (center). Alteration frequencies were plotted for a subset of significant genes (left and right panels) broken down by group (local versus met and ER-positive IDC versus ILC). Error bars represent the binomial 90% confidence interval. (B) NF1 alteration frequencies in the primary and recurrent breast cohorts from Yates et al. were calculated in CDH1-WT and CDH1-Mutant populations. Error bars represent the 90% binomial confidence interval. (C) Treatment and NF1 mutational status for two patients. Endocrine therapies are bolded. (D) Venn diagram examining the mutual exclusivity of ESR1 and NF1 in the entire breast cohort. Odds ratios and P-values were calculated using the Fisher’s exact test. (E) Quantification of CDH1-WT or CDH1-KD cells following T47D co-mixing experiments. For each background, 2.5 × 10⁴ T47D-shNF1-GFP cells and 4.75 × 10⁵ T47D-mCherry cells were mixed and treated with solvent control or 4-OHT for 10 days or 17 days, and fraction of cells with GFP or mCherry were measured by flow cytometry analysis. Plotted is the ratio of GFP-positive cells to mCherry-positive cells for each condition. **P < 0.01 from the Fisher’s exact test (B) or Student’s t-test (E). FACT, FoundationACT.

