. 2018 Oct 3;11(1):72–88. doi: 10.1039/c8nr05520c

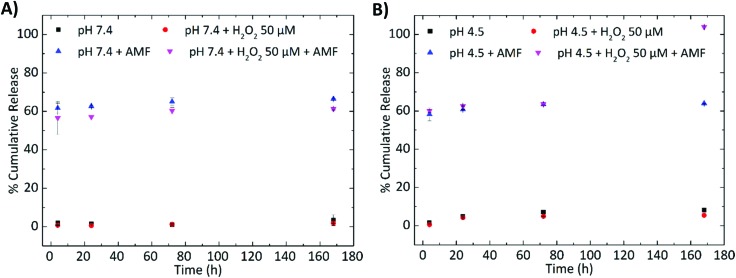
Fig. 3. Release profile of TMZ at various time points (4, 24, 72, and 168 h) and under various treatments at (A) pH 7.4 and (B) pH 4.5. The presented values are given as the mean ± standard error of 3 different measurements. LMNVs present a controlled and sustained release profile when pH is 7.4 and 4.5, while their release profile changes when hyperthermia is applied. The combination of pH and H2O2, which is used to simulate the conditions of ROS excess in cancer cells, does not significantly affect the release of TMZ, but the combination of a low pH, which can be found in lysosomes (4.5), an increased H2O2 concentration, and hyperthermia leads to 100% release, demonstrating the stimuli-responsive nature of the LMNVs.

Fig. 3