. 2018 Oct 3;11(1):72–88. doi: 10.1039/c8nr05520c

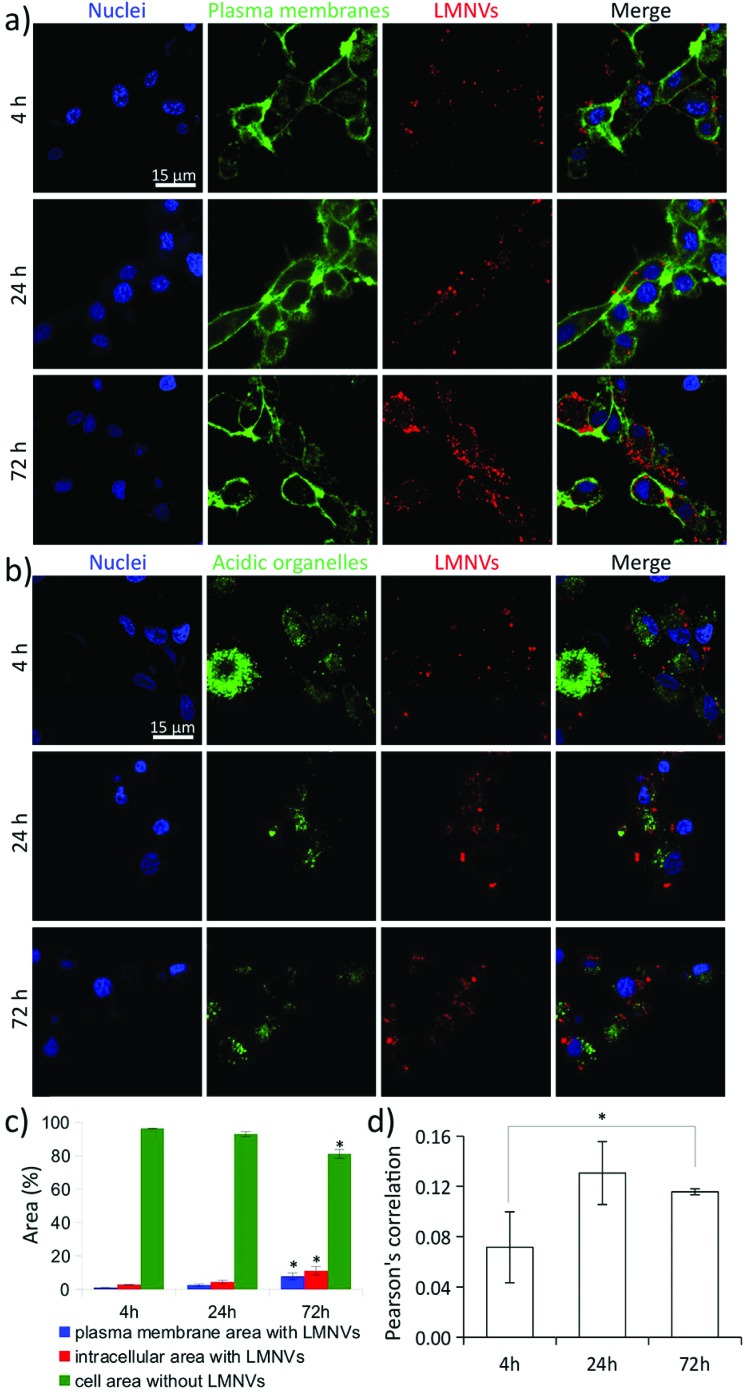
Fig. 4. Investigation of the progressive LMNV uptake by U-87 MG cells: nanovector association with plasma membranes and internalization in acidic organelles at 4, 24 and 72 h of treatment. (A) Confocal laser scanning microscopy (CLSM) imaging of LMNVs (in red), U-87 MG cell membranes (in green), and nuclei (in blue); (B) CLSM imaging of LMNVs (in red), acidic organelles (in green), and nuclei (in blue); (C) histograms presenting the area (%) of plasma membrane signal co-localizing with LMNVs (in blue), of the intracellular region with LMNVs (in red), and of the whole cell (plasma membrane + intracellular region) without LMNVs (in green); (D) histogram presenting Pearson's correlation analysis among the signals of LMNVs and of the acidic organelles. *p < 0.05.

Fig. 4