. 2018 Nov 21;143(24):6095–6102. doi: 10.1039/c8an01291a

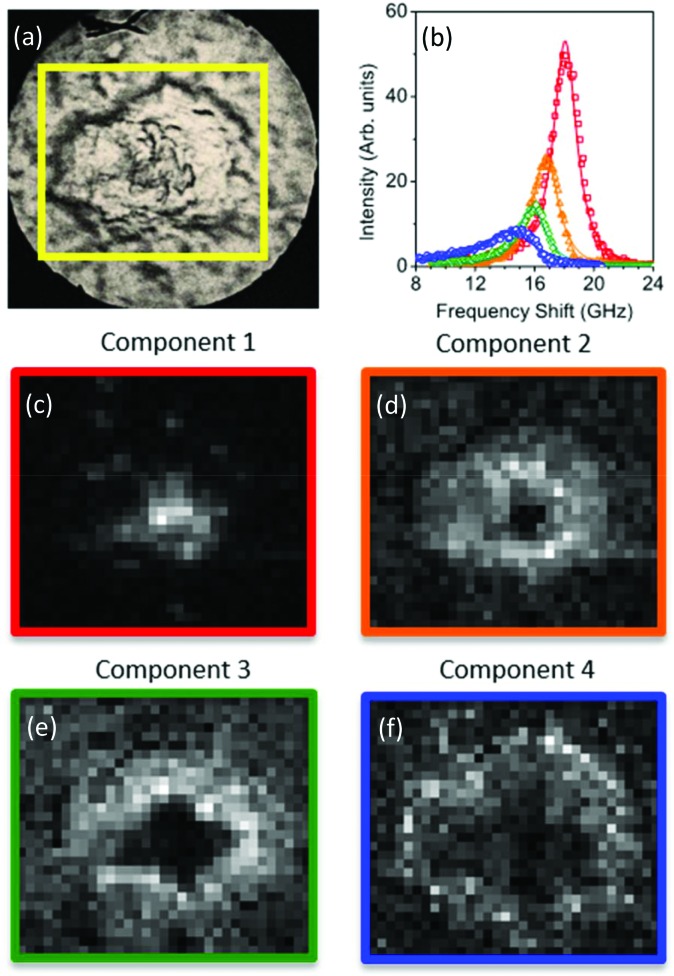
Fig. 3. (Top panel) Reflection optical image of a plaque in a transgenic mouse brain section and factorisation basis spectra retrieved by NMF. (a) Photomicrograph of the plaque with a yellow box denoting the region of the Brillouin map. (b) Spectra of the four factorisation components. Symbols denote the data and lines indicate the DHO fit result. The components are colour coded so that (middle and bottom panels) the corresponding concentration maps are also presented. The four components can be attributed (see text) to the distribution of (c) the plaque core made of β-sheet structures, presenting a spectrum with the largest frequency shift, (d) a first intermediate region, (e) a second intermediate, more diffuse region, and (f) the periphery of the plaque having a broad linewidth and small frequency shift, plausibly related to the lipid-rich region of the astrocyte processes. The greyscale of the concentration maps goes from 0 (black) to 1 (white). The map corresponds to a 66 × 60 μm2 area of the specimen acquired with a step size of 1.5 μm.

Fig. 3