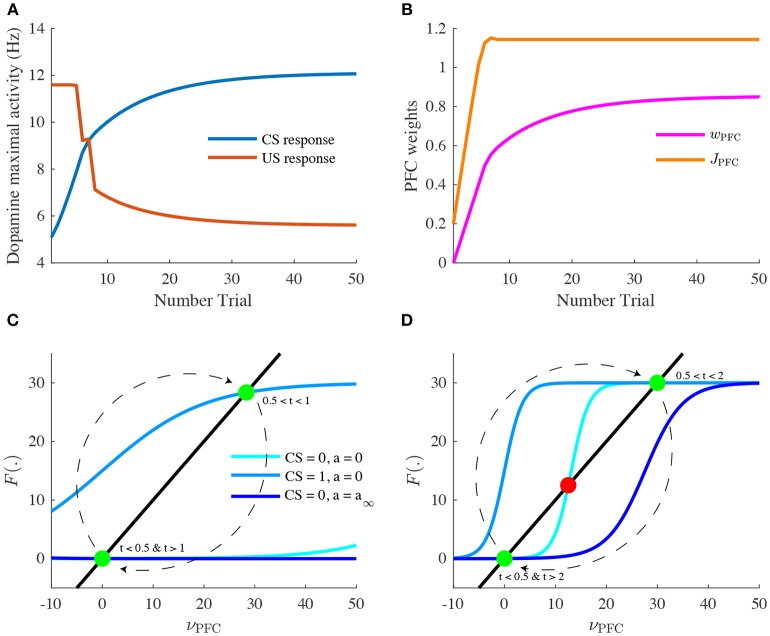
Figure 4.
Learning of reward timing and magnitude during classical-conditioning. (A) The maximal activity of the VTA DA neurons at the CS onset (blue line) and at the reward delivery (orange line) is plotted for each trial of the conditioning task. These values are computed by taking the maximum value of the firing rate of the DA neurons in a small time window (200 ms) after the CS and the US onsets. (B) PFC weights showing two phases of learning: learning of the US timing by PFC recurrent connections weight (JPFC, orange line) and learning of the reward value by the weights of PFC neurons onto VTA neurons (wPFC-D and wPFC-G, magenta line). (C,D) Phase analysis of PFC neuron activity from Equation (8) before learning (C) and after learning (D). Different times of the task are represented: t < 0.5 s (before CS onset, light blue) and 1 s < t < 2 s (between CS offset and US onset, light blue), 0.5 s < t < 1 s (during CS presentation, medium blue) and t > 2 s (after US onset, dark blue). Fixed points are represented by green (stable) or red (unstable) dots. Dashed arrows: trajectories of the system from t = 0 to t = 3 s.

