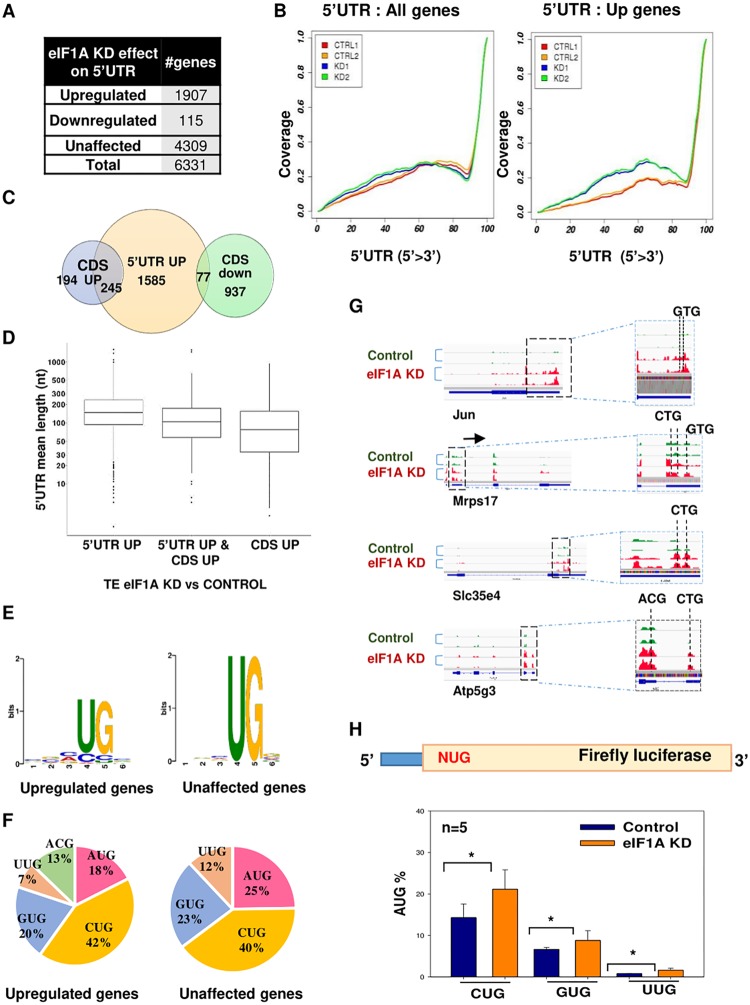
FIG 5.
Broad elevation of 5′ UTR initiation upon eIF1A depletion. (A) The number of genes with the indicated alteration in 5′ UTR translation upon eIF1A KD. (B) Meta-gene analysis of the distribution of normalized reads in the 5′ UTR of all analyzed genes (n = 6,331) and upregulated genes (n = 1,907). (C) Venn diagram showing the overlap between CDS upregulated, CDS downregulated, and 5′ UTR upregulated genes. (D) Box plot showing the relation between the 5′ UTR length and the translation efficiency in eIF1A KD versus control samples for 5′ UTR upregulated genes, CDS upregulated genes, and both 5′ UTR and CDS upregulated genes. (E) Comparison of the nucleotide context of the 5′ UTR translation initiation site (TIS) in unaffected and upregulated genes. (F) Pie chart showing the frequency of the start codon in the ribosome footprints in the 5′ UTR in the unaffected and upregulated gene sets. (G) Tracks showing the ribosome profiling reads along various mRNAs with upregulation in ribosome density in the 5′ UTR for replicate samples of each control and eIF1A KD sample. (H) MEFs were transfected with control or eIF1AX plus eIF1A(18) siRNA and 48 h later cells were cotransfected again with the siRNA pool with a firefly luciferase reporter gene driven by AUG, CUG, GUG, and UUG as translation initiation codons, as shown schematically on the top. The Renilla luciferase reporter gene was also cotransfected and served as a normalizing control. The activities of NUG in control and eIF1A KD cells are presented as a percentage of that for AUG for the indicated number of independent experiments (average ± standard error). *, statistically significant differences (P < 0.05).

