. 2018 Nov 23;143(24):6113–6120. doi: 10.1039/c8an01461b

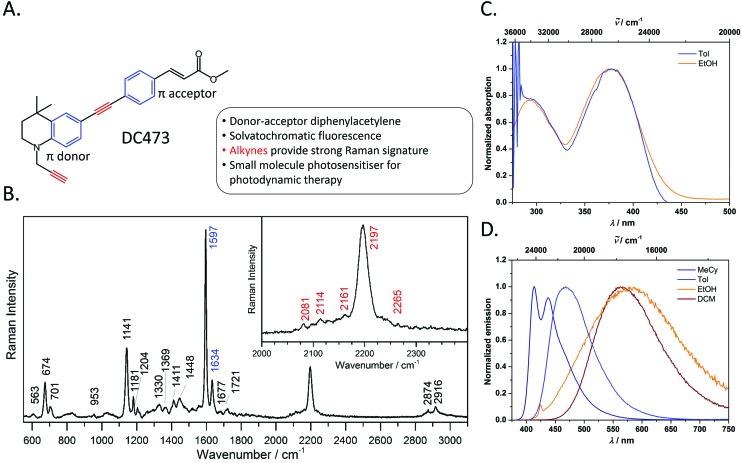
Fig. 1. A. Chemical structure and summary of the properties of photosensitiser, DC473. B. Raman spectrum of DC473, in the solid state, taken with the 40× and 785 nm laser excitation; the inset shows the C Created by potrace 1.16, written by Peter Selinger 2001-2019 C band. The Raman signals corresponding to the alkyne and phenyl groups are indicated in red and blue on the peak labels, respectively. The main Raman bands tracked in this study are the 1597 cm–1 phenyl C Created by potrace 1.16, written by Peter Selinger 2001-2019 C stretch and the 2197 cm–1 C Created by potrace 1.16, written by Peter Selinger 2001-2019 C stretch vibrations. C. Absorption and D. emission spectra of DC473 in a variety of solvents MeCy = methylcyclohexane, Tol = toluene and DCM = CH2Cl2.

Fig. 1