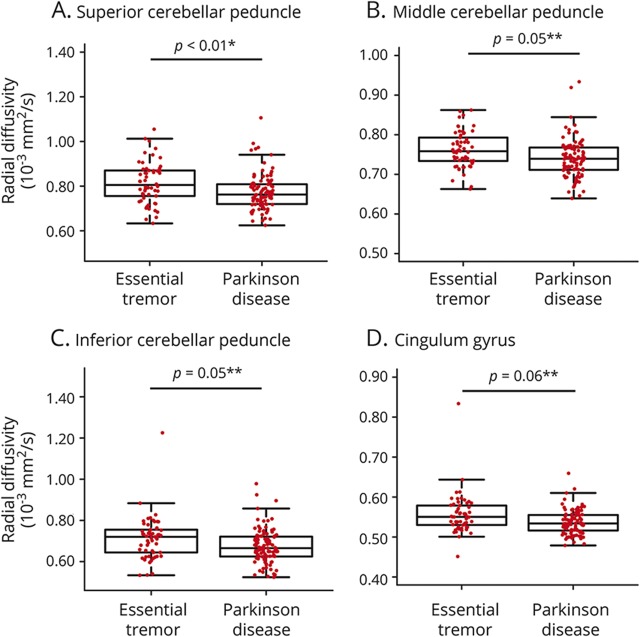
Figure 3. Radial diffusivity.
Box-and-whisker plots are shown here for all participants with essential tremor and Parkinson disease with the median, 25th and 75th percentiles, and 1.5 times the interquartile range indicated by the middle line, box, and whiskers, respectively. Radial diffusivity values are displayed for the superior cerebellar peduncle (A), middle cerebellar peduncle (B), inferior cerebellar peduncle (C), and cingulum (D). *Significance after false discovery rate (FDR) correction; **marginal significance not surviving FDR correction.

