. 2018 Dec 3;11(1):8–16. doi: 10.1039/c8ay01798k

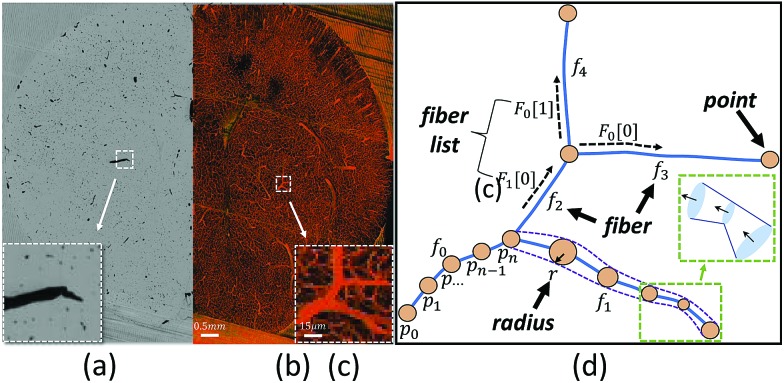
Fig. 7. Mouse brain microvasculature reconstructed from 1000 KESM sections. (a) A raw section (xy image) is shown, with microvascular cross-sections stained black using an India-ink perfusion. An inset shows a close-up of the India-ink embedded sample, in which vessels are stained black. (b) A maximum intensity projection of all 1000 KESM sections shows the overall structure of the sample. (c) An inset shows a viable ROI containing several inlets and outlets problematic for modeling. (d) Our approach represents the ROI network as a graph-like model with geometric components including points (orange dots), fibers (blue lines), and radii (dashed purple lines). The fiber lists F0 and F1 associated with each pivot point store fiber connectivity (e.g. a fiber in F0 has geometry specified outward from the given point). An inset shows visualizing fibers as a series of truncated generalized cones (TGCs) in AFAN. (b) SB = 0.5 mm. (c) SB = 15 μm.

Fig. 7