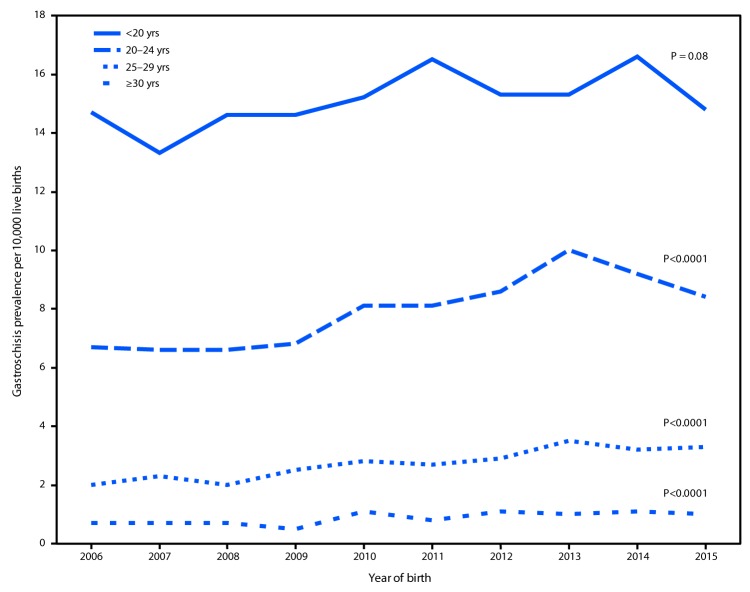
FIGURE 1.
Trends in gastroschisis prevalence, by maternal age group — 20 states, 2006–2015*
* States contributing to the figure: Arizona, CDC/Georgia (Metropolitan Atlanta Congenital Defects Program), Illinois, Kansas, Kentucky, Louisiana (2010–2015), Massachusetts, Minnesota, Nebraska, New Jersey, New York, North Carolina, Ohio (2010–2015), Rhode Island, South Carolina (2010–2015), Tennessee (2010–2015), Texas, Utah, Vermont (2009–2015), and Virginia. Data were provided from 2006 to 2015 unless otherwise noted.

