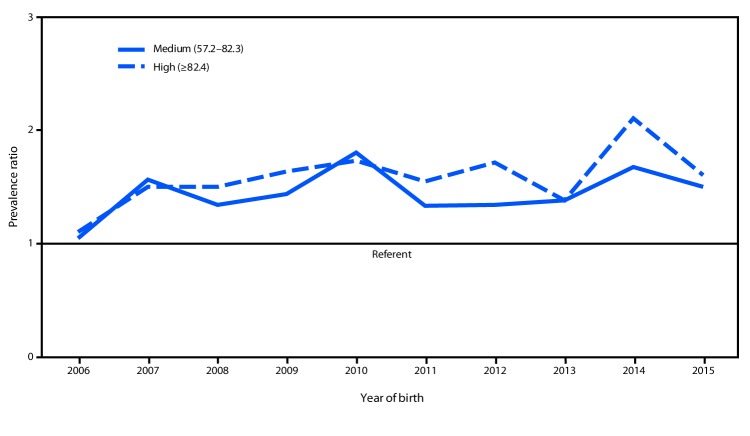
FIGURE 2.
Trends in gastroschisis prevalence ratio, by year* and annual opioid prescription rate category† — 20 states, 2006–2015§
* Overall prevalence ratio for medium opioid prescription rate category and high opioid prescription rate category versus low opioid prescription rate category for each year of the study period 2006–2015.
† Opioid prescription rate categories include medium (57.2–82.3 prescriptions per 100 persons) and high (≥82.4 prescriptions per 100 persons). The low opioid prescription rate category (<57.2 prescriptions per 100 persons) was used as the reference group.
§ States contributing to the figure: Arizona, CDC/Georgia (Metropolitan Atlanta Congenital Defects Program), Illinois, Kansas, Kentucky, Louisiana (2010–2015), Massachusetts, Minnesota, Nebraska, New Jersey, New York, North Carolina, Ohio (2010–2015), Rhode Island, South Carolina (2010–2015), Tennessee (2010–2015), Texas, Utah, Vermont (2009–2015), and Virginia. Data were provided from 2006 to 2015 unless otherwise noted.

