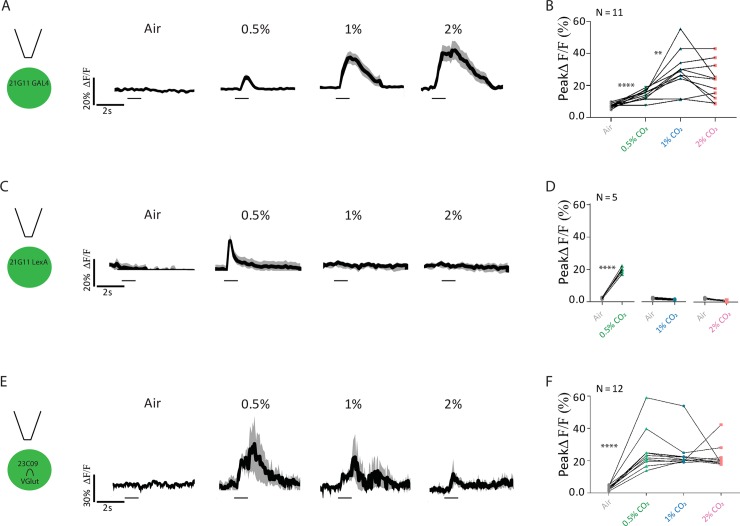
Fig 2. Physiological response to CO2 of 21G11 and 23C09 neurons.
(A, C, and E) LH activity of 21G11-GAL4, 21G11-LexA and 23C09∩VGlut, respectively, to air, 0.5%, 1%, and 2% of CO2. Schematics of the experiment and average time course of GCaMP6m intensity change. The black bar indicates the time of the stimulus. The black trace represents the average, while the gray shows the range of individual traces. (B, D, and F) Peak GCaMP6m intensity change after stimulation with air, 0.5%, 1%, and 2% of CO2. **p < 0.01, ****p < 0.0001. Comparisons are made between tested concentrations. All p values are calculated with Wilcoxon signed-rank test. LH, lateral horn.

