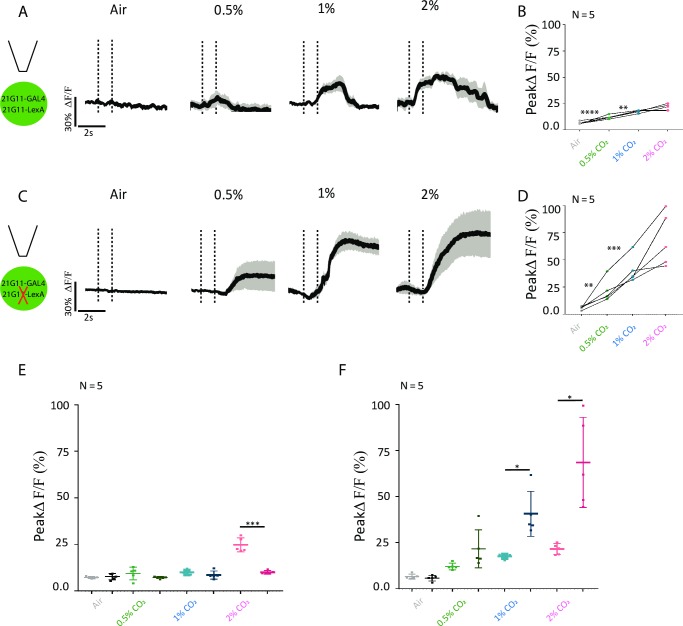
Fig 5. 21G11 neurons change their response profile when their 21G11-LexA subset is silenced.
(A) Schematics of the experiment and calcium response at the LH, using GCaMP6m, of 21G11 neurons to air, 0.5%, 1%, and 2% of CO2. (B) Peak GCaMP6m intensity change after stimulation with air, 0.5%, 1%, and 2% of CO2. (C) Schematics of the experiment and calcium response at the LH of 21G11 neurons to air, 0.5%, 1%, and 2% of CO2 while 21G11-LexA neurons are silenced by expression of Kir2.1. (D) Peak GCaMP6m intensity change after stimulation with air, 0.5%, 1%, and 2% of CO2. (E–F) Peak GCaMP6m intensity change during stimulation period (E) and poststimulation period (F), with air, 0.5%, 1%, and 2% of CO2 for both (B) values on the left and (D) values on the right. For (A) and (C), the average time course of GCaMP6m intensity change is shown. The vertical dashed lines indicate the time of the stimulus. *p < 0.05, **p < 0.01, ****p < 0.0001. All p values are calculated with Wilcoxon signed-rank test. LH, lateral horn.

