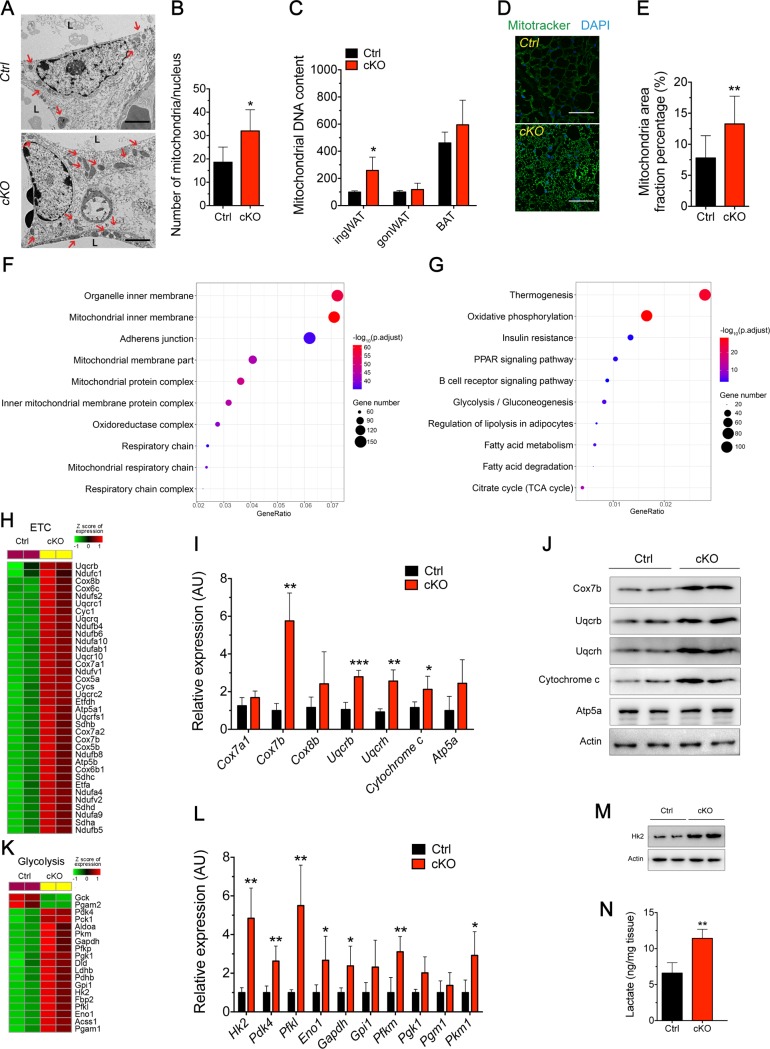
Fig 5. Deletion of Oct3 induced mitochondria biogenesis and enhanced mitochondria function and glycolysis in ingWAT.
Ctrl and cKO mice were housed at 4°C for 1 month. (A) TEM images of ingWAT sections. Red arrows indicate mitochondria. (B) Mitochondrial number per nucleus determined from electron micrographs. (C) Mitochondrial DNA content determined in ingWAT, gonWAT, and BAT (n = 4). (D) Representative figures of MitoTracker staining in ingWAT. (E) Positive signals of MitoTracker quantified as percentage total cells. (F, G) ClusterProfiler package in R was used to test for enrichment of cellular component (panel F) and KEGG pathway (panel G). Dot color indicates statistical significance (−log10p.adjust value); dot size represents the gene numbers annotated to each term. (H) Heat maps of relative expression levels of ETC genes in ingWAT of Ctrl and cKO mice. (I) mRNA expression of genes associated with mitochondrial respiratory chain complex genes and other mitochondrial genes in ingWAT (n = 6). (J) Western blots of mitochondrial respiratory chain complex proteins in ingWAT. (K) Heat maps of relative expression levels of glycolytic genes in ingWAT of Ctrl and cKO mice. (L) mRNA expression of genes associated with glycolysis in ingWAT (n = 6). (M) Western blots of proteins associated with glycolysis in ingWAT. (N) The amount of lactate in ingWAT. Data in B–C, E, I, L, and N were analyzed by Student t test. All images shown are representative of three experiments. The numerical data underlying this figure are included in S1 Data. AU, arbitrary unit; BAT, brown adipose tissue; cKO, conditional knockout; Ctrl, control; ETC, electron transport chain; gonWAT, gonadal white adipose tissue; ingWAT, inguinal white adipose tissue; KEGG, Kyoto Encyclopedia of Genes and Genomes; Oct3, organic cation transporter 3; TEM, transmission electron microscope.

