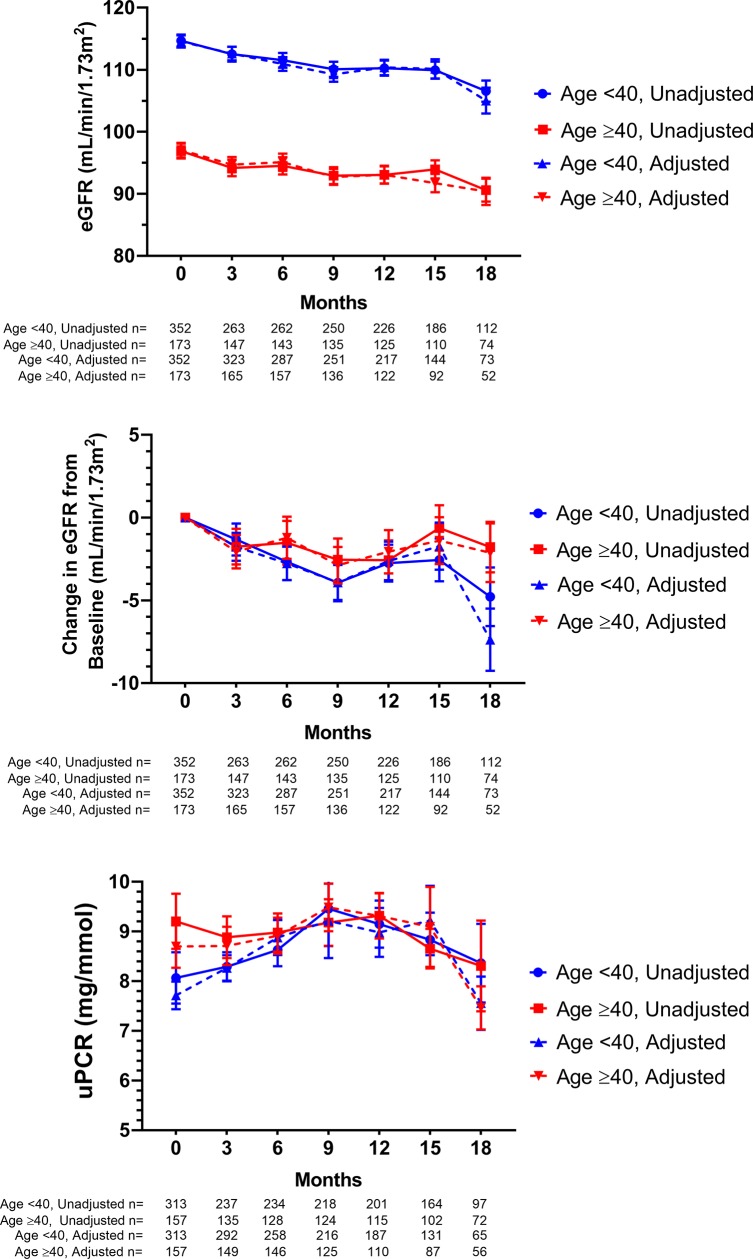
Fig 1. Change in renal function indices over time by age group.
Time shown is months since enrolment in the EPIC-NSW trial (unadjusted) or cumulative months PrEP exposure (adjusted). The latter accounted for any temporary interruptions of medication. All graphs show mean ± SEM. eGFR—estimated glomerular filtration rate, uPCR—urinary protein to creatinine ratio.

