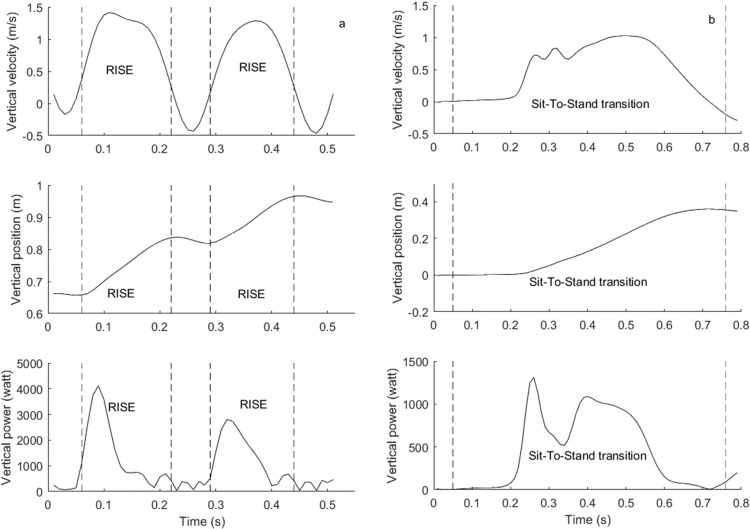
Fig 1.
Graphical visualization of the sensor-based analyses of vertical velocity, position and power in stair ascent (a) and sit-to-stand (b) tests in a 27-year old man. Dashed lines mark the rise phase (a) or sit-to-stand transition (b) of the movement. In stair ascent, two steps are visualized. In sit-to-stand, one transition from sit to stand is visualized.

