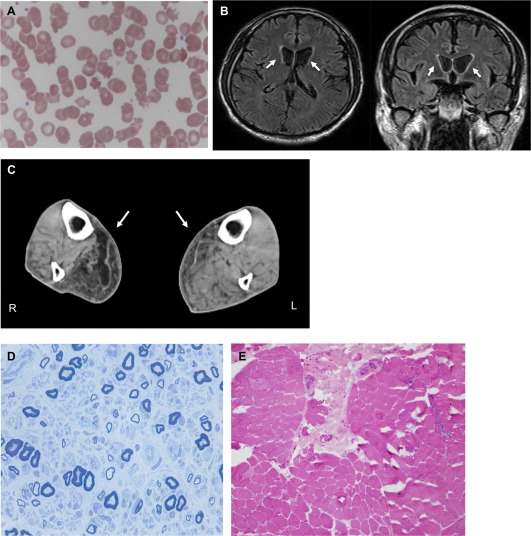
Figure 1.

(A) Acanthocytosis in the peripheral blood. A peripheral blood smear shows 9% acanthocytes. (B) Brain MRI images. Axial and coronal sections of fluid attenuated inversion recovery images revealed the bilateral atrophy of caudate nuclei, primarily on the left side (arrows). (C) Muscle CT images. Axial sections of the gastrocnemius muscles demonstrate asymmetrical muscular atrophy with fat replacement (arrows). (D) Toluidine blue staining of a sural nerve section. The section exhibits moderate myelinated fiber loss and axonal degeneration. (E) Hematoxylin and eosin staining of the biceps brachii muscle section. The section shows both mild neurogenic changes with grouped atrophy and mild myogenic changes with a few necrotic fibers.
