
Figure 6.
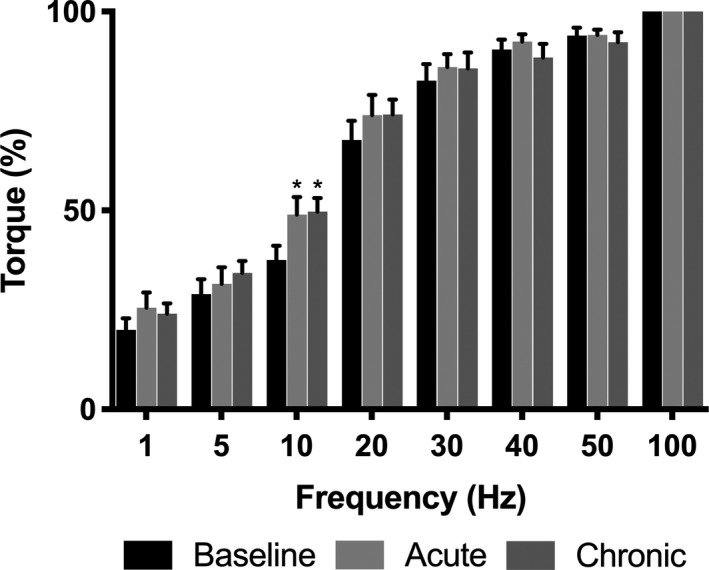
Torque‐frequency curve of the plantar flexors following stimulation of the tibial nerve at baseline and following acute and chronic BRJ supplementation. Data normalized to a percentage of torque produced at 100 Hz. Values reported as mean ± SE, n = 12. *Significantly greater compared to baseline.