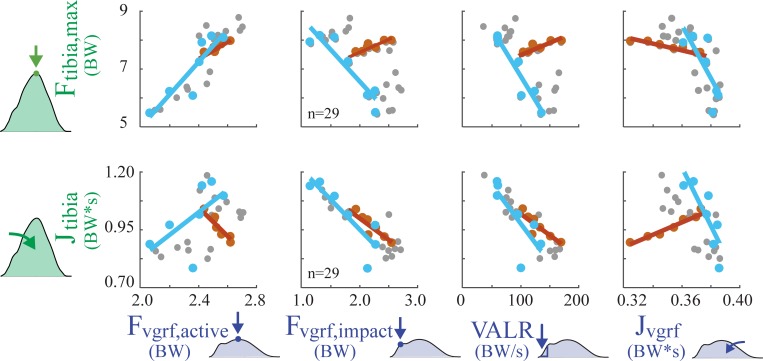
Fig 5. Force trends due to changing speed vs. changing slope for a single subject (Subject 1).
Lines represent regression results for GRF metrics vs. tibial bone load metrics when only speed or slope was varied. Dark orange dots represent conditions when speed was varied while running on a fixed slope (level ground). Light blue dots represent conditions when ground slope was varied while speed is held constant (at 2.6 m/s). Small gray dots are all remaining parameter sweep conditions.

