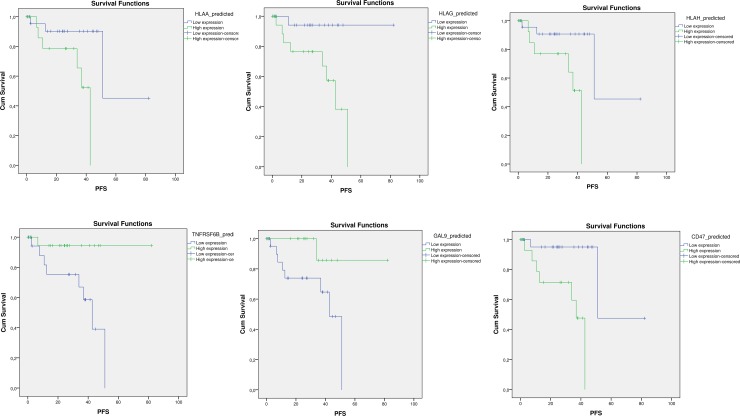
Fig 5. For Kaplan-Meier analysis, predicted values of the genes of interest were generated using General Linear Model to account for clinical confounding variables and were dichotomized using median value as cut-off.
For each gene, Log-rank (Mantel-Cox) analysis was performed to assess statistical differences in Progression-Free Survival time between patients with Low and High expression. Only graphs for significant data are shown.

