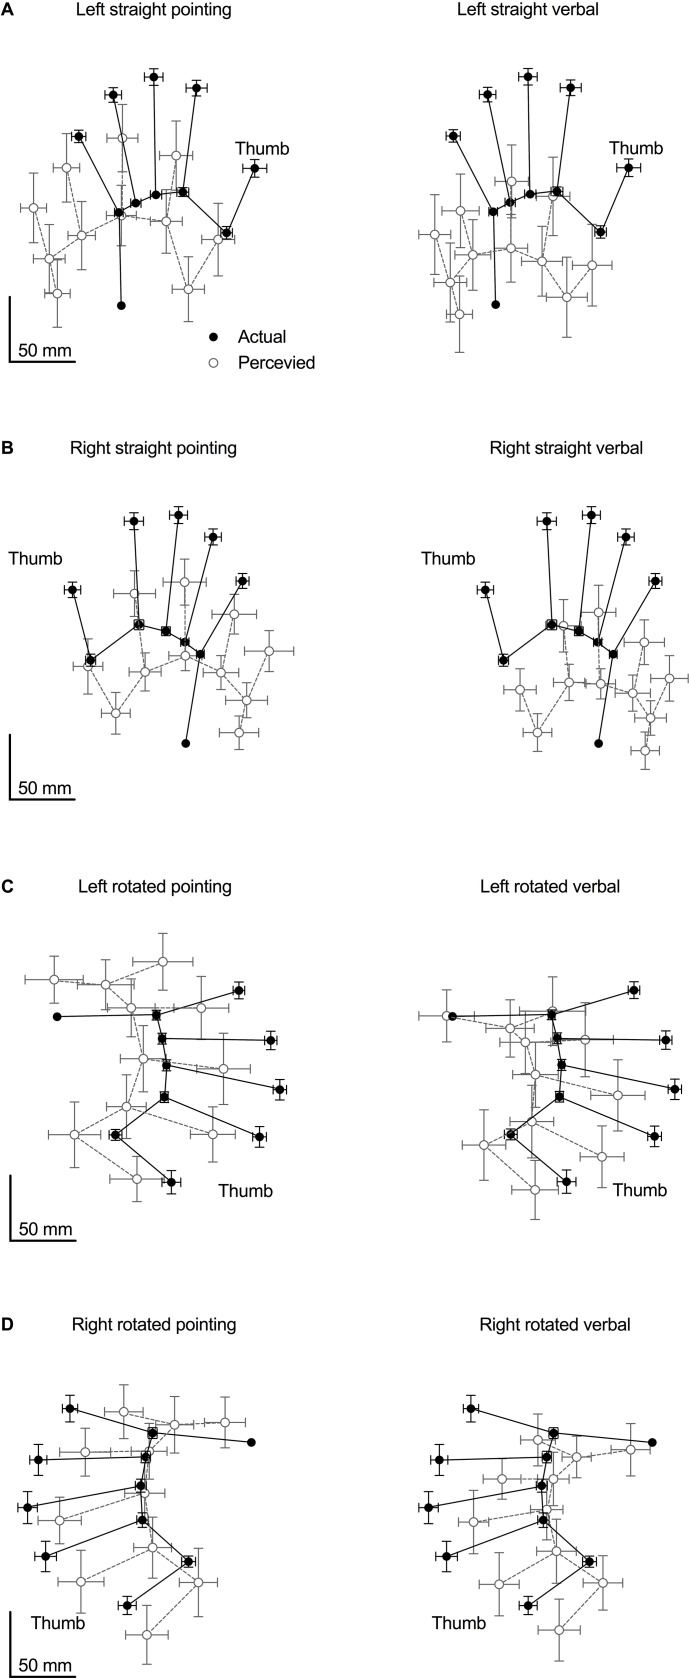
Fig 3. Pooled data.
The mean position of all 11-landmark pointing and verbal localisation judgements (shown separately) compared to the mean actual location of each landmark in each of the four hand orientations. The black circles show the mean actual location of each of the 11 landmarks. The unfilled grey circles show the mean judged location of each of the 11 landmarks. Error bars depict 95% confidence intervals. (A) Pointing vs. verbal responses when the left hand is straight. (B) Pointing vs. verbal responses when the right hand is straight. (C) Pointing vs. verbal responses when the left hand is rotated. (D) Pointing vs. verbal responses when the right hand is rotated.

