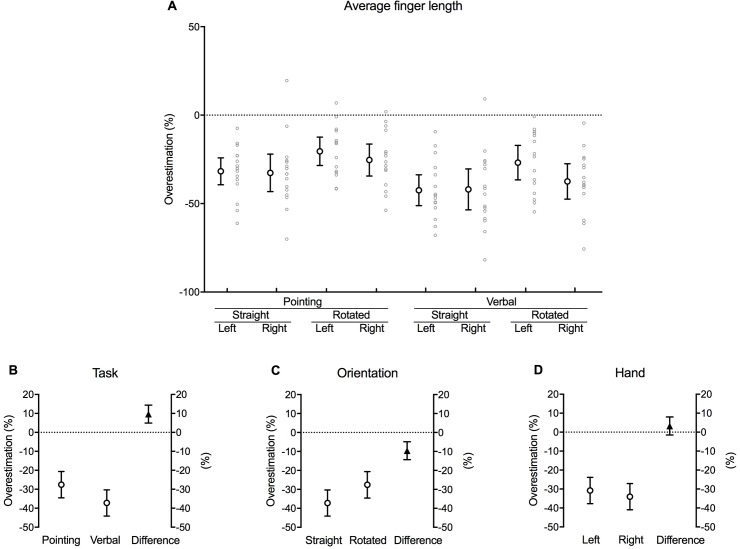
Fig 8. Finger length.
(A) Mean difference between actual and perceived length of the five fingers for each combination of task, orientation and hand as a percentage of actual finger length (large white circles with error bars, which depict 95% confidence intervals). Adjacent small grey circles represent individual data points. (B) The difference between pointing and verbal localisation tasks, (C) straight and rotated hand orientations, and (D) the left and right hand after the data were fitted to a fixed effects with a random intercept model. The white circles in each graph show the estimated marginal mean values for each factor within each main effect. The black triangles show the mean difference between each factor (this value corresponds to its respective b coefficient). Error bars depict 95% confidence intervals.

