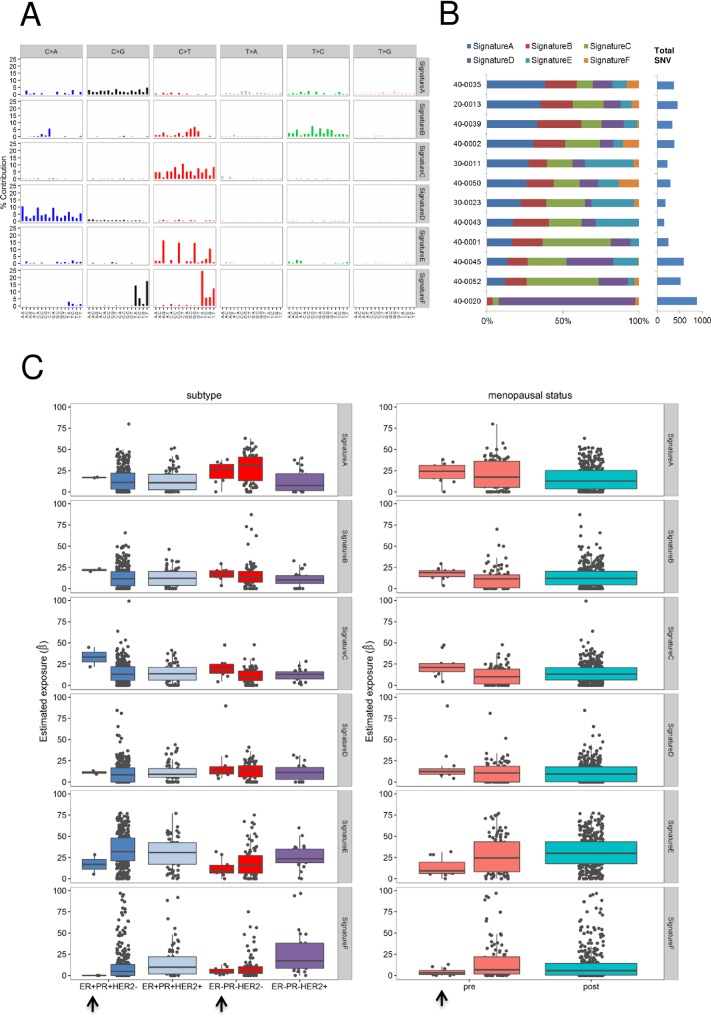
Fig 4. Mutational signatures identified in TCGA and PRECAMA samples, and their relationship with tumor subtype and patient menopausal status.
(A) The 6 mutational signatures identified in 453 TCGA samples (including preBC and postBC) plus 12 PRECAMA samples. The 6 types of base substitutions are color-coded and further stratified by their adjacent 5′ and 3′ sequence context. Sig.A matches with COSMIC signature-3; Sig.B matches with COSMIC signature-26; Sig.C matches with COSMIC signatures-11/19/23/30 and experimental signatures of MNU and MNNG; Sig.D matches with COSMIC signature-18; Sig.E matches with COSMIC signature-1; and Sig.F matches with COSMIC signatures-2/13 (see Table A in S1 File). (B) Percentage contributions of the 6 mutational signatures to the SNVs found in PRECAMA samples. (C) Percentage contributions of the 6 mutational signatures in the PRECAMA and TCGA samples stratified by tumor IHC subtypes (left graphs) and by menopausal status (right graphs). PRECAMA samples are indicated with arrows.

