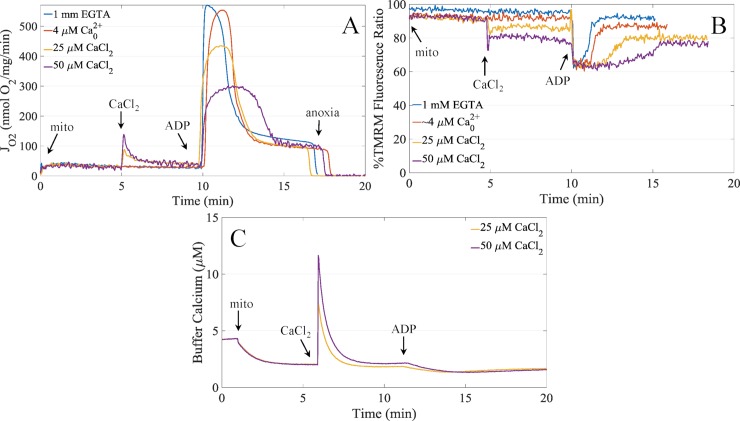
Fig 1. Representative respiration, membrane potential and calcium uptake dynamics.
A) Mitochondrial respiration rates demonstrating the calcium-dependent inhibition of ADP-stimulated respiration. B) Corresponding membrane potential values inferred from TMRM fluorescence quenching. Data are cleaned of injection artifacts and calibration portions. C) Corresponding calcium uptake dynamics for the 25 μM and 50 μM CaCl2 boluses. Experimental conditions are given in the Methods.

