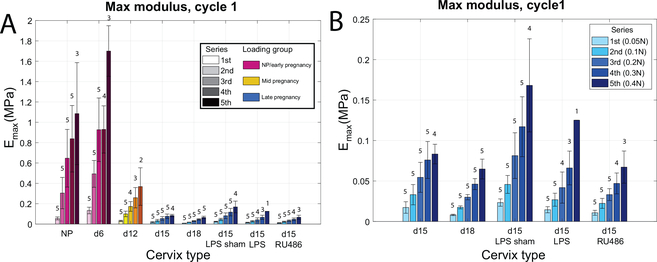
Figure 6: Stiffening behavior with increasing load levels for each specimen group.
a) Max modulus Emax calculated on the loading curve of cycle 1 for all series. Note that all specimen groups are not subjected to the same loading (different colors). Numbers above bars indicate how many samples made it to the associated series of loading (out of n=5). b) Subset of panel A to focus on the late pregnancy group which were all subjected to the same loading regimen.

