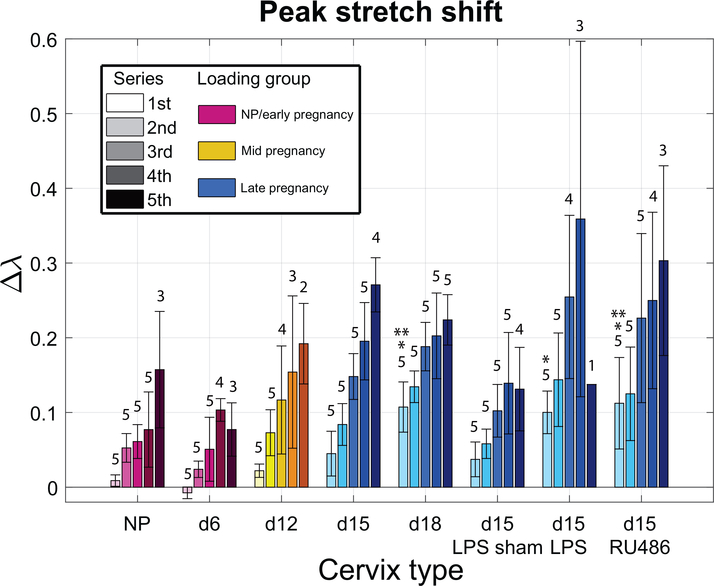
Figure 8: Evolution of stretch shift parameter with loading for all specimen groups.
Stretch shift Δλ for the different specimen groups calculated as the difference between peak stretch of cycle 1 and 3 for each series. Overall, there is an increase in permanent deformation for the d15 and d18 groups compared to NP, d6 and d12 indicated by the increase in stretch shift Δλ. Additionally, the PTB models and d18 have an increase in stretch shift compared to d15 and d15-LPS sham. Numbers indicate how many samples made it to the associated series (out of n=5). * indicates statistical significance compared to NP, d6 and d12 for the first load series (p<0.05). ** indicates statistical significance compared to d15 and d15-LPS sham for the first load series (p<0.05).

