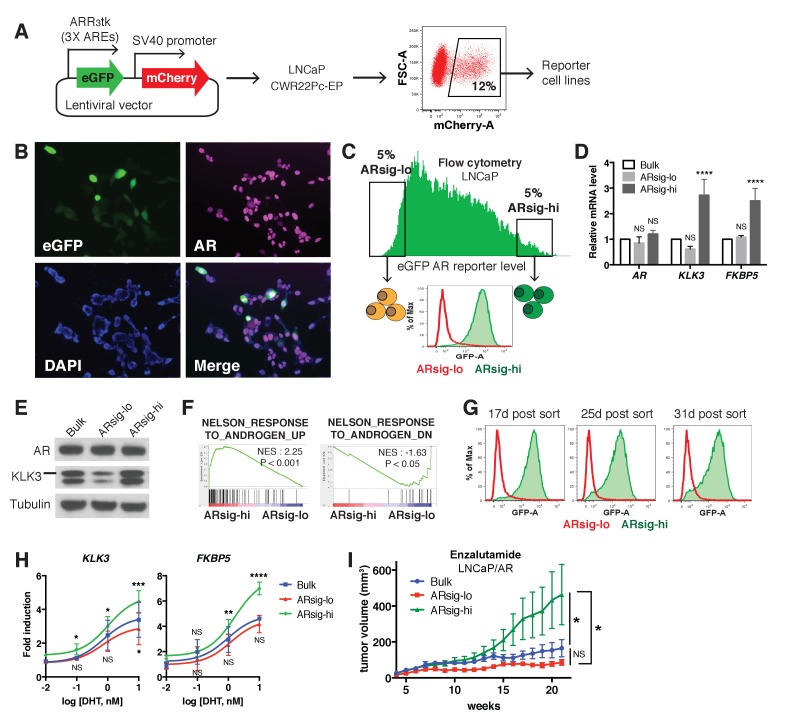
Figure 1. Characterization of prostate cancer cells with low vs. high AR output.
(A) The LNCaP and CWR22Pc-EP reporter cell lines were generated by lentiviral infection with the eGFP AR reporter construct (details can be found in Materials and methods). Cells with stable integration of the construct were positively sorted by mCherry expression using flow cytometry. (B) LNCaP cells infected with the AR reporter display variable expression levels of eGFP (green) and AR (magenta). Nuclei were labeled with DAPI (blue). (C) LNCaP cells with low (ARsig-lo) or high (ARsig-hi) AR activities were sorted using flow cytometry based on eGFP AR-reporter expression. (D–E) LNCaP ARsig-hi cells have higher AR output while having the same level of AR. The q-PCR data (D) is presented as mean fold change ±SD relative to the bulk population. NS = not significant, ****p<0.0001, one-way ANOVA compared to the bulk population. (F) Gene set enrichment analysis (GSEA) shows that the gene sets up- and down-regulated by androgen are enriched in LNCaP ARsig-hi and ARsig-lo cells, respectively. (G) LNCaP ARsig-lo and ARsig-hi cells maintain their AR activity levels over time. (H) LNCaP ARsig-hi cells showed enhanced upregulation of AR target genes in response to DHT treatment. The q-PCR data is presented as mean fold change ±SD relative to the DMSO control. NS = not significant, *p<0.05, **p<0.01, ***p<0.001, ****p<0.0001, one-way ANOVA compared to the bulk population. (I) LNCaP/AR xenografts derived from ARsig-hi cells become resistant to enzalutamide faster than other populations. The bulk, sorted ARsig-lo and ARsig-hi cells were injected into physically castrated mice and the mice were treated with enzalutamide immediately after injection. Data is presented as mean ±SEM (N = 10). NS = not significant, *p<0.05, one-way ANOVA.
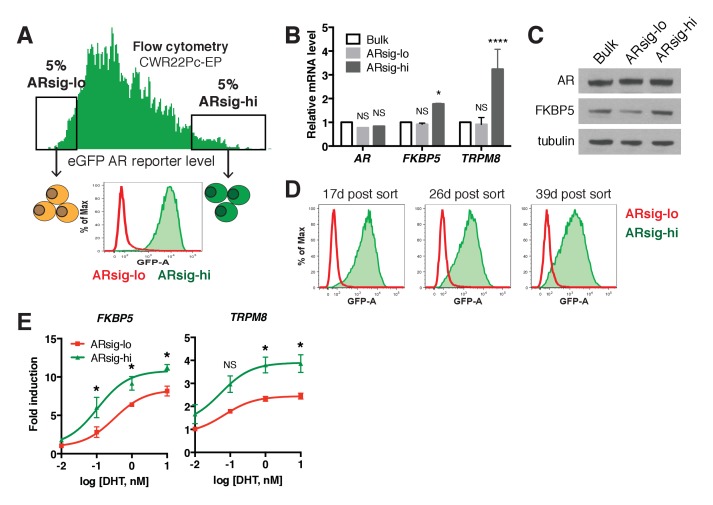
Figure 1—figure supplement 1. Characterization of CWR22Pc-EP prostate cancer cells with low vs. high AR output.
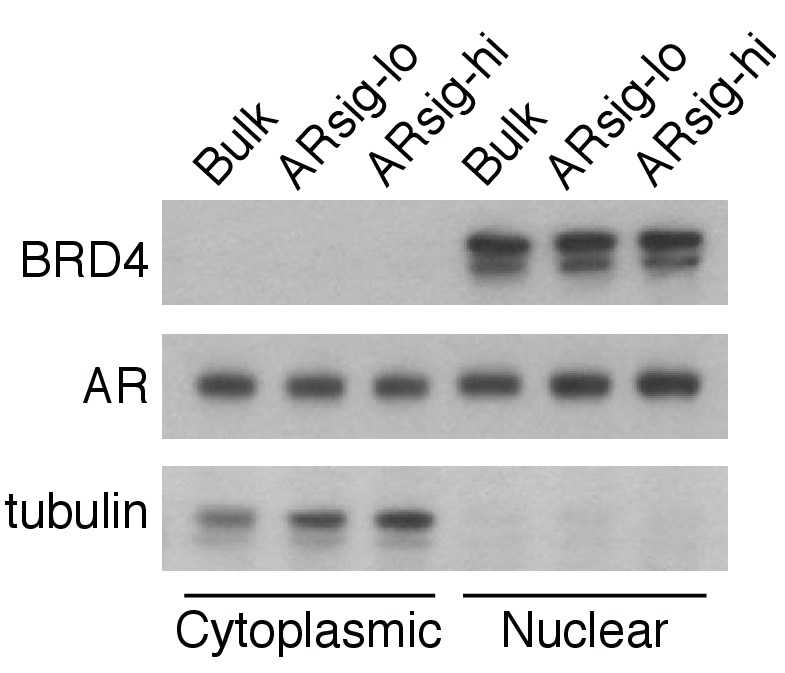
Figure 1—figure supplement 2. LNCaP ARsig-lo and ARsig-hi cells have comparable nuclear AR levels.

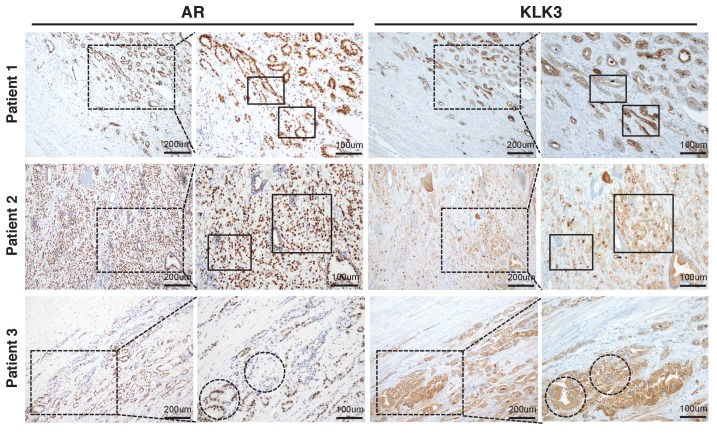
Figure 1—figure supplement 3. Characterization of LNCaP/AR prostate cancer cells with low vs. high AR output.


