. 2019 Jan 7;8:e41741. doi: 10.7554/eLife.41741

Figure 2. The dark state tunnel of GtACR1.

(A) A cross-section view of the GtACR1 dimer showing two continuous intramolecular tunnels traversing from extracellular ports to the cytoplasmic cavity; retinal (green). (B) A cross-section view of a GtACR1 protomer showing the conformation of the transmembrane ion tunnel and retinal binding pocket connected at the retinylidene Schiff base position. (C) The tunnel (dots) detected by CAVER with tunnel-lining residues (sticks): charged (red), polar (cyan), and apolar residues (clay). (D) The tunnel profile of GtACR1 detected by CAVER; the arrows indicate three constrictions C1-C3.

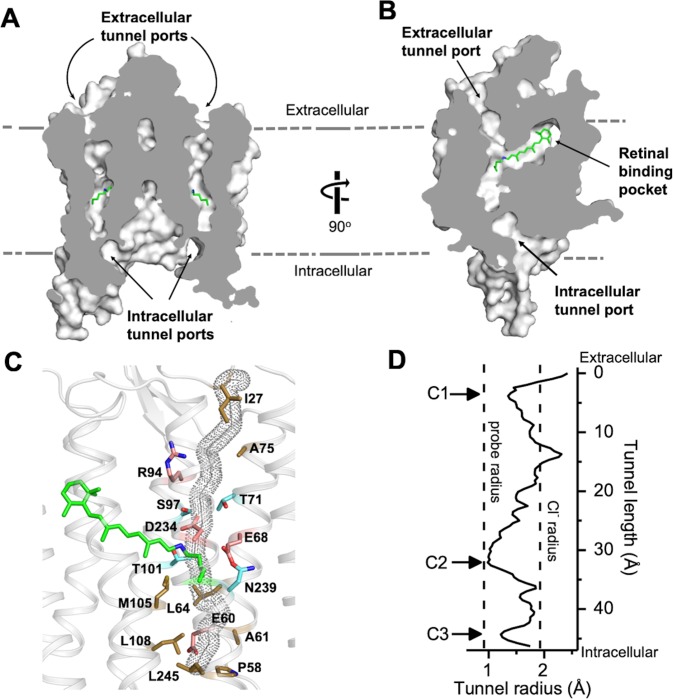
Figure 2.

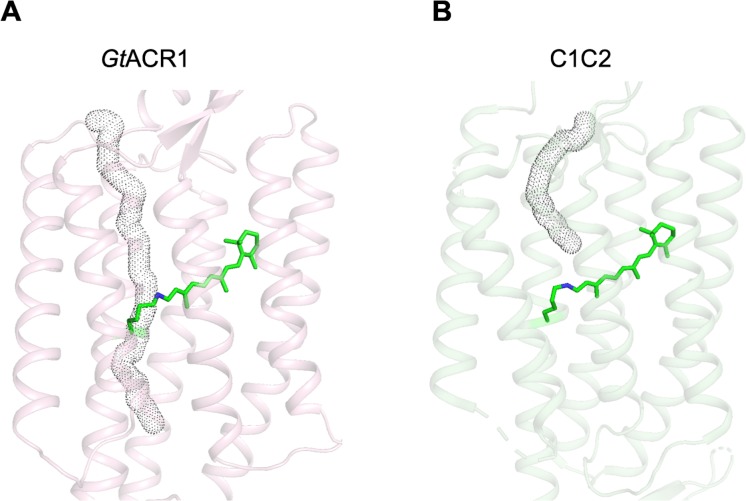
Figure 2—figure supplement 1. The predicted tunnel path of GtACR1.

Figure 2—figure supplement 1.

(A) and C1C2 (B) The tunnel paths (dark dots) are predicted by CAVER (probe radius 0.9 Å). Retinal molecules are depicted as green sticks.
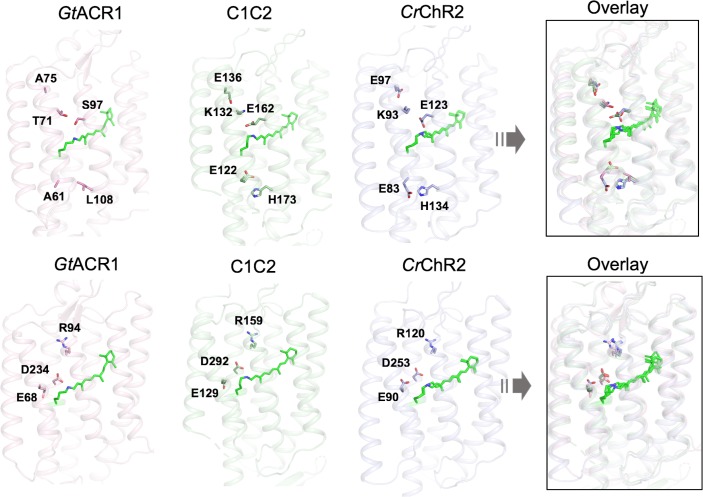
Figure 2—figure supplement 2. Comparison of selected tunnel-lining residues in GtACR1 with their counterparts in C1C2 and CrChR2.

Figure 2—figure supplement 2.

The five residues in the GtACR1 tunnel that are different from those in C1C2 and CrChR2 are shown on top, and the three highly-conserved tunnel-lining residues in these molecules are shown at bottom. The rightmost panels show overlays of the three structures.