. 2019 Jan 7;8:e41741. doi: 10.7554/eLife.41741

Figure 3. Features of the ion pathway of GtACR1.

(A) The N-terminal extracellular loop (orange) immobilized by an intracellular C21-C219 disulfide bridge (red) to the TM6-7 loop (blue); an H-bond network (black dashed lines) formed by residues (sticks) near the extracellular port. (B) The hydrophobic segment (orange) blocks the extracellular port rendered by the electrostatic potential surface. Rectangle: closer (rotated) view of the peptide cap conformation. (C) Decay kinetics of laser flash-evoked photocurrents by the wild-type GtACR1 and indicated mutants. (D–F) The structure of the three constrictions: C1 (D), C2 (E), and C3 (F). (G) Peak photocurrents generated by Glu substitutions of the constriction residues in response to a 1 s light pulse (515 nm, 7.7 mW mm−2) with 131 mM Cl- in the pipette and 6 mM Cl- in the bath. The black squares, mean; line, median; box, SE; whiskers, SD; empty diamonds, raw data recorded from individual cells.

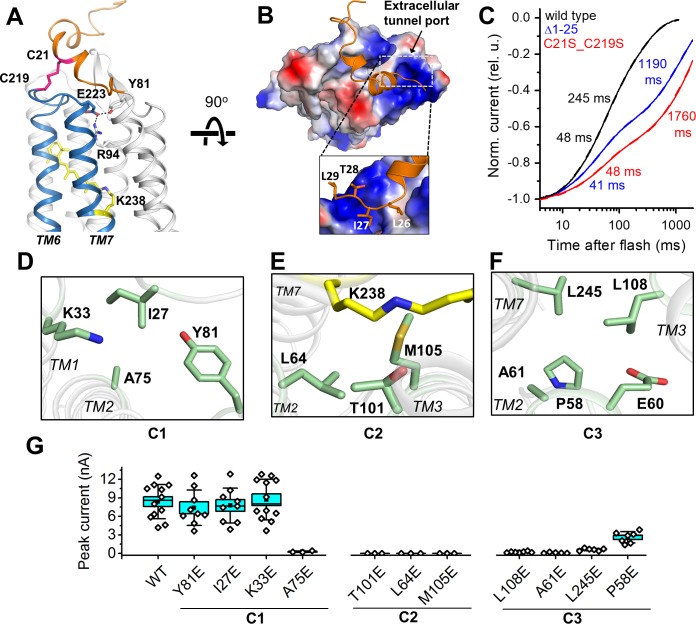
Figure 3—source data 1. Numerical data for the current amplitude values measured in individual cells are shown in Figure 3G.
DOI: 10.7554/eLife.41741.020
Figure 3—source data 2. Numerical data for the reversal potential values measured in individual cells are shown in Figure 3—figure supplements 4 and 6.
DOI: 10.7554/eLife.41741.021
Figure 3—source data 3. Numerical data for the reversal potential values measured in individual cells are shown in Figure 3—figure supplement 9A.
DOI: 10.7554/eLife.41741.022
Figure 3—source data 4. Numerical data for the reversal potential values measured in individual cells are shown in Figure 3—figure supplement 9B.
DOI: 10.7554/eLife.41741.023

Figure 3.

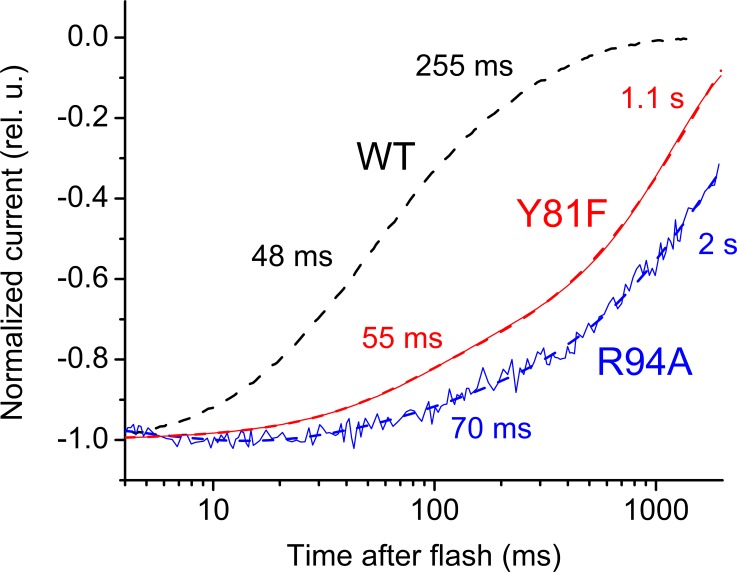
Figure 3—figure supplement 1. Laser flash-evoked photocurrents generated by the GtACR1_Y81F and R94A mutants, as compared to the wild-type.

Figure 3—figure supplement 1.

Thin solid lines are recorded traces, and thick dashed lines are multiexponential fits. The numbers are the time constants of individual decay phases.
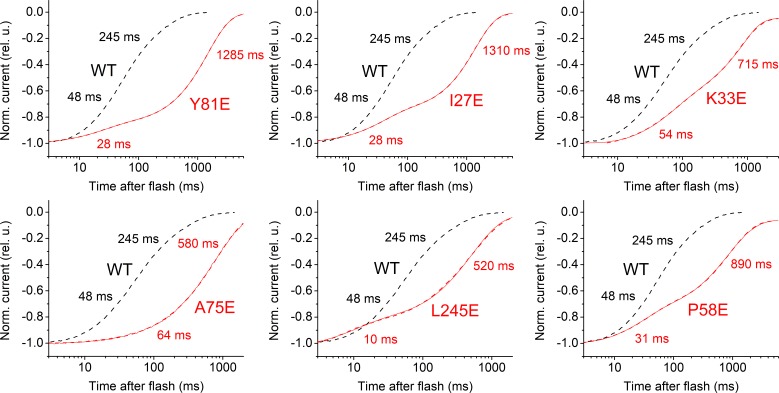
Figure 3—figure supplement 2. Laser flash-evoked photocurrents generated by the mutants of the C1 and C3 residues.

Figure 3—figure supplement 2.

Thin solid lines are recorded traces, and thick dashed lines are multiexponential fits. The numbers are the time constants of individual decay phases.
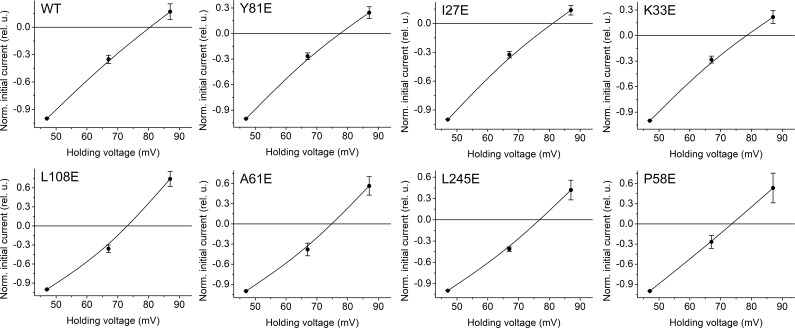
Figure 3—figure supplement 3. The current-voltage relationships of the the mutants of the C1 and C3 residues measured under a Cl- gradient.

Figure 3—figure supplement 3.

The data points are mean normalized values measured in 5–8 cells (the exact numbers for each mutant are in Table 2), approximated with a B-spline function; the error bars show the sem. For more details see Materials and methods.
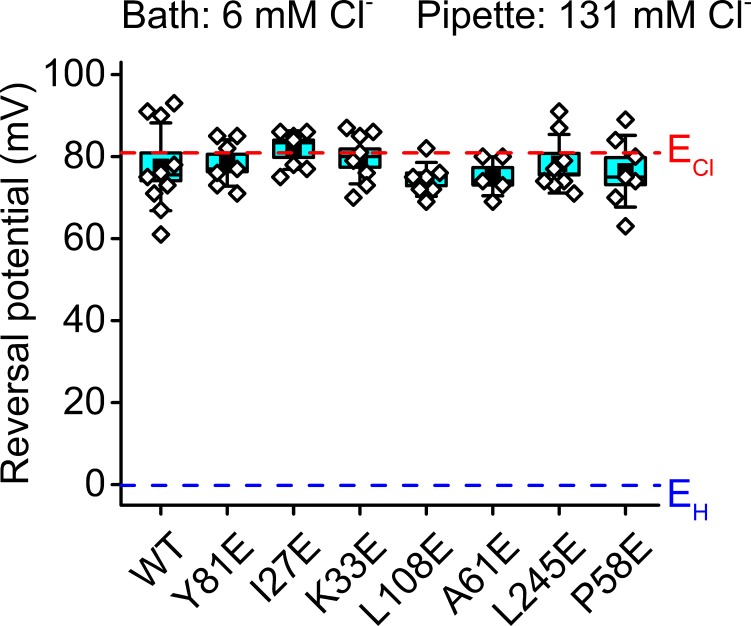
Figure 3—figure supplement 4. The reversal potentials in the mutants of the C1 and C3 residues determined under a Cl- gradient.

Figure 3—figure supplement 4.

The values obtained in individual cells are shown as empty diamonds; the box shows the sem, the whiskers, the sd. The results of Kruskal–Wallis ANOVA are in Table 2.
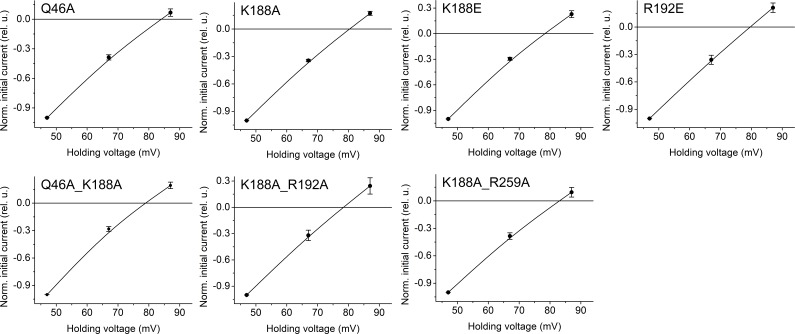
Figure 3—figure supplement 5. The current-voltage relationships of the mutants of Q46 and positively charged residues measured under a Cl- gradient.

Figure 3—figure supplement 5.

The data points are mean normalized values measured in 7–13 cells (the exact numbers for each mutant are in Table 3), approximated with a B-spline function; the error bars are the sem. For more details see Materials and methods.
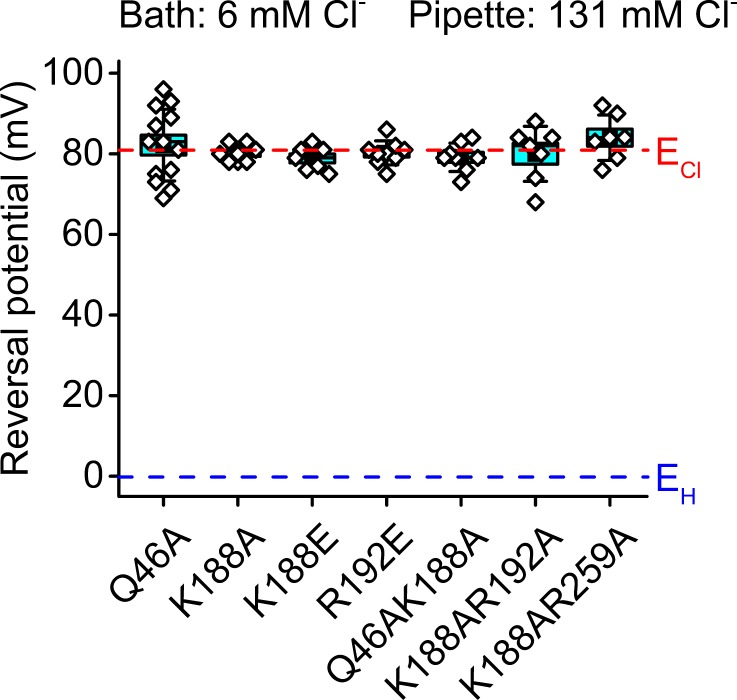
Figure 3—figure supplement 6. The reversal potentials in the mutants of Q46 and positively charged residues determined under a Cl- gradient.

Figure 3—figure supplement 6.

The values obtained in individual cells are shown as empty diamonds; the box shows the sem, the whiskers, the sd. The results of Kruskal–Wallis ANOVA are in Table 2.
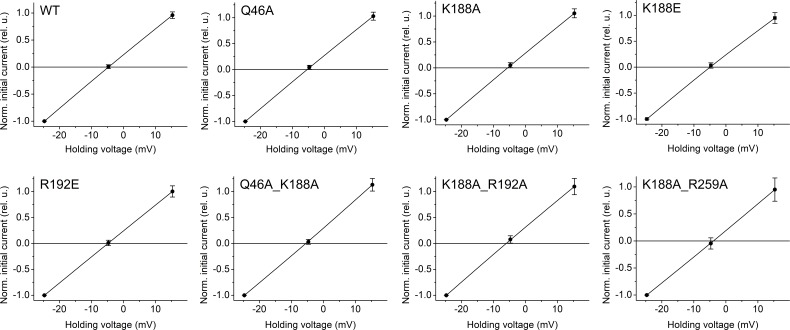
Figure 3—figure supplement 7. The current-voltage relationships of the mutants of Q46 and positively charged residues measured under a H+ gradient.

Figure 3—figure supplement 7.

The data points are mean normalized values measured in 6–8 cells (the exact numbers for each mutant are in Table 3), approximated with a B-spline function; the error bars are the sem. For more details see Materials and methods.
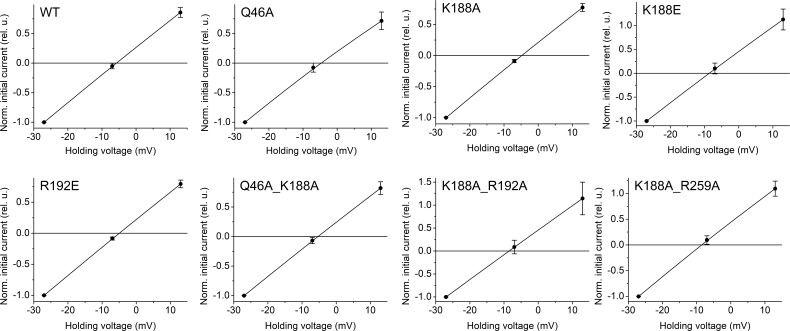
Figure 3—figure supplement 8. The current–voltage relationships of the mutants of Q46 and positively charged residues measured under a Na+ gradient.

Figure 3—figure supplement 8.

The data points are mean normalized values measured in 6–11 cells (the exact numbers for each mutant are in Table 4), approximated with a B-spline function; the error bars are the sem. For more details see Materials and methods.
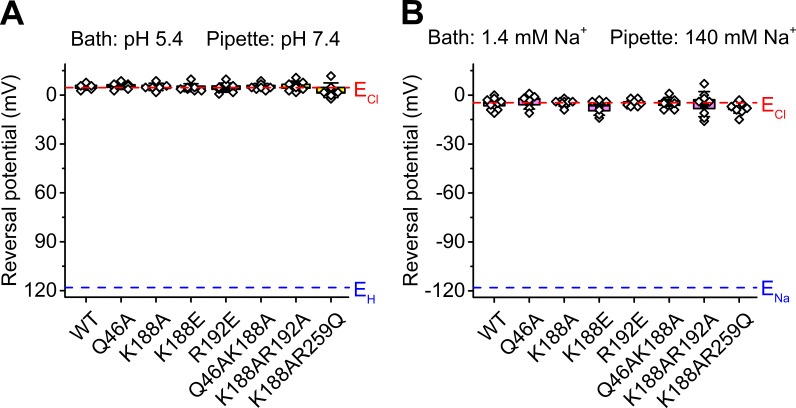
Figure 3—figure supplement 9. The reversal potentials in the mutants of Q46 and positively charged residues determined under H+ and Na+ gradients.

Figure 3—figure supplement 9.

The values obtained in individual cells are shown as empty diamonds; the box shows the sem, the whiskers, the sd. The results of Kruskal–Wallis ANOVA are in Table 3 and 4.