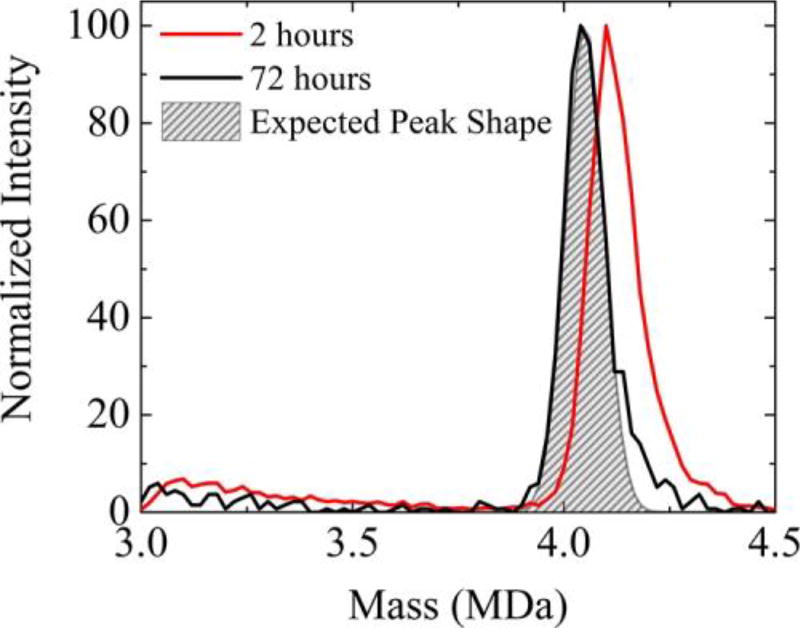
Figure 3.
Expanded view of the CDMS spectrum showing the capsid peak at different times. The red trace shows the high mass range of the the assembly reaction. Each point represents a single ion. There are two clusters of ions with average charges centered around 140 and 155 e (elementary charges). Both clusters have masses around 4.1 MDa, though the lower charge cluster has a slightly broader distribution of masses and a slightly larger average mass. The higher charge cluster has around twice as many ions as the lower. Figure 4B shows the scatterplot for ions measured 24 h after initiation of the assembly reaction. At this time point, the low charge cluster has largely disappeared. Thus, the more highly charged cluster of ions that persists after 24 h is attributed to the T = 4 capsid.

